A new Intervals Companion App. With widgets!

yeah that should say 1.6.1, build 1. I see it in my TestFlight and I just double checked to make sure the correct group has access, so external Testflight users should see it. Maybe give it a bit or check back later. I’m not sure what country you’re in but perhaps it takes Apple a little while to propagate it globally.

[edit] - oh I know what it is. 1.6.1 is considered as a new build so it has to go through the longer review process and that takes 12-48 hours. Followups builds go through a lot faster, but since this is the first 1.6.1 it will take a while

1 Like

Got it now

1 Like

Is it OK for me to provide feedback here or do you need it via the TestFlight thing?

It was a bit hard to do it through TestFlight so here is my feedback…

First thing: it is fantastic, and I can confirm that the day range bug on the Totals page is fixed. The new MTD and WTD are great, as is the new ability to select a custom day range of less than two weeks.

Issues found / suggestions…

  1. Custom date selector behaves inconsistently across pages. On Fitness and Vitals pages, when To date is today (e.g. 18 June), the latest From date available for selection is 11 June (minimum range = 8 days). On Activities page, the latest From date available is 17 June (minimum range = 2 days). On Totals page, the latest From date available for selection is 12 June (minimum range = 7 days). Also on Activities page, if there are no activities in the chosen custom date range (may also apply to day range buttons; not sure), much older activities are displayed.
    SUGGESTION: make the custom date selector on all pages behave like the Totals page (minimum range = 7 days), and fix display bug on Activities page (e.g. message ‘No activities in the selected range’).

  2. Toggling between date range picker buttons (not YTD, MTD or WTD) and custom date selector potentially causes confusion and wrong results, as does refreshing results after selecting new custom date range. Switching from the former to the latter adds 1 day (in the custom date range) to the range selected immediately prior with the range picker buttton. To see this click e.g. 14D button, then click on custom date range button. The selected dates in the custom date range will be e.g. 4 June to 18 June (15 days) instead of 5 June to 18 June (14 days). If you then select a completely different custom date range, the results will change accordingly, but if you then refresh by swiping down, the results will change back to the (last) 15 day range even though the custom date range is completely different. Furthermore, if you toggle back to 14D picker button (by de-selecting calendar icon), the last 15 day period is shown instead of changing back to 14D. And if you switch to another picker and then back to 14D to get the correct 14D result, and then swipe down to refresh, the result changes to the last 15 day period.
    SUGGESTION: when switching from picker button to custom range, make the custom range default to the range that was selected with picker button immediately prior. Also, refreshing page after making a custom date selection should not change the results. Also, switching from custom date selection back to picker button should display the result for the picker button.

  3. Form graph on Fitness page can lack context on y-axis.
    SUGGESTION: if there is enough vertical space, consider expanding Form graph y-axis to show all zones (like on Intervals.icu), even if the curve has not touched those zones during the selected timeframe. This would give the user a visual clue as to how close/far away they are from entering other zones. In the example below, it is hard to know where the red, blue and yellow zones start.

  1. Vitals page does not show data from Garmin Health Snapshot.
    SUGGESTION: Allow option for HRV and HR (resting) to come from Garmin Health Snapshot (even better if SpO2 from Garmin Health Snapshot can also be added, but not a big deal). Note that Garmin Health Snapshot uses SDRR instead of SDNN. This would greatly increase the utility for Garmin users (I can explain why in more detail if you want), and especially for those who only wear their watch during activities.

  1. Activities page.
    SUGGESTION: add WTD button (MTD not needed as activities are already grouped under month).

  2. Vitals page
    SUGGESTION: consider showing data points on graphs. Also, I think the curve for things like weight, HRV, HR and (maybe) Vo2max should be drawn from data point to data point, instead of staying constant in the absence of new data until the day before there is a change? Because for example suppose you measured your weight at the start of the month, and then again at the start of the next month, and there is a 5 kg difference, that change probably would have occurred gradually as opposed to suddenly on the day before the second measurement. Just a minor thing though. Fine to keep it the way it is if that’s how intervals.icu draws the curve. But I think showing data points would still be good.

Great feedback and finds. Thanks!

I took a quick look and some of these are simple fixes that I’ll add to my list. A few quick thoughts:

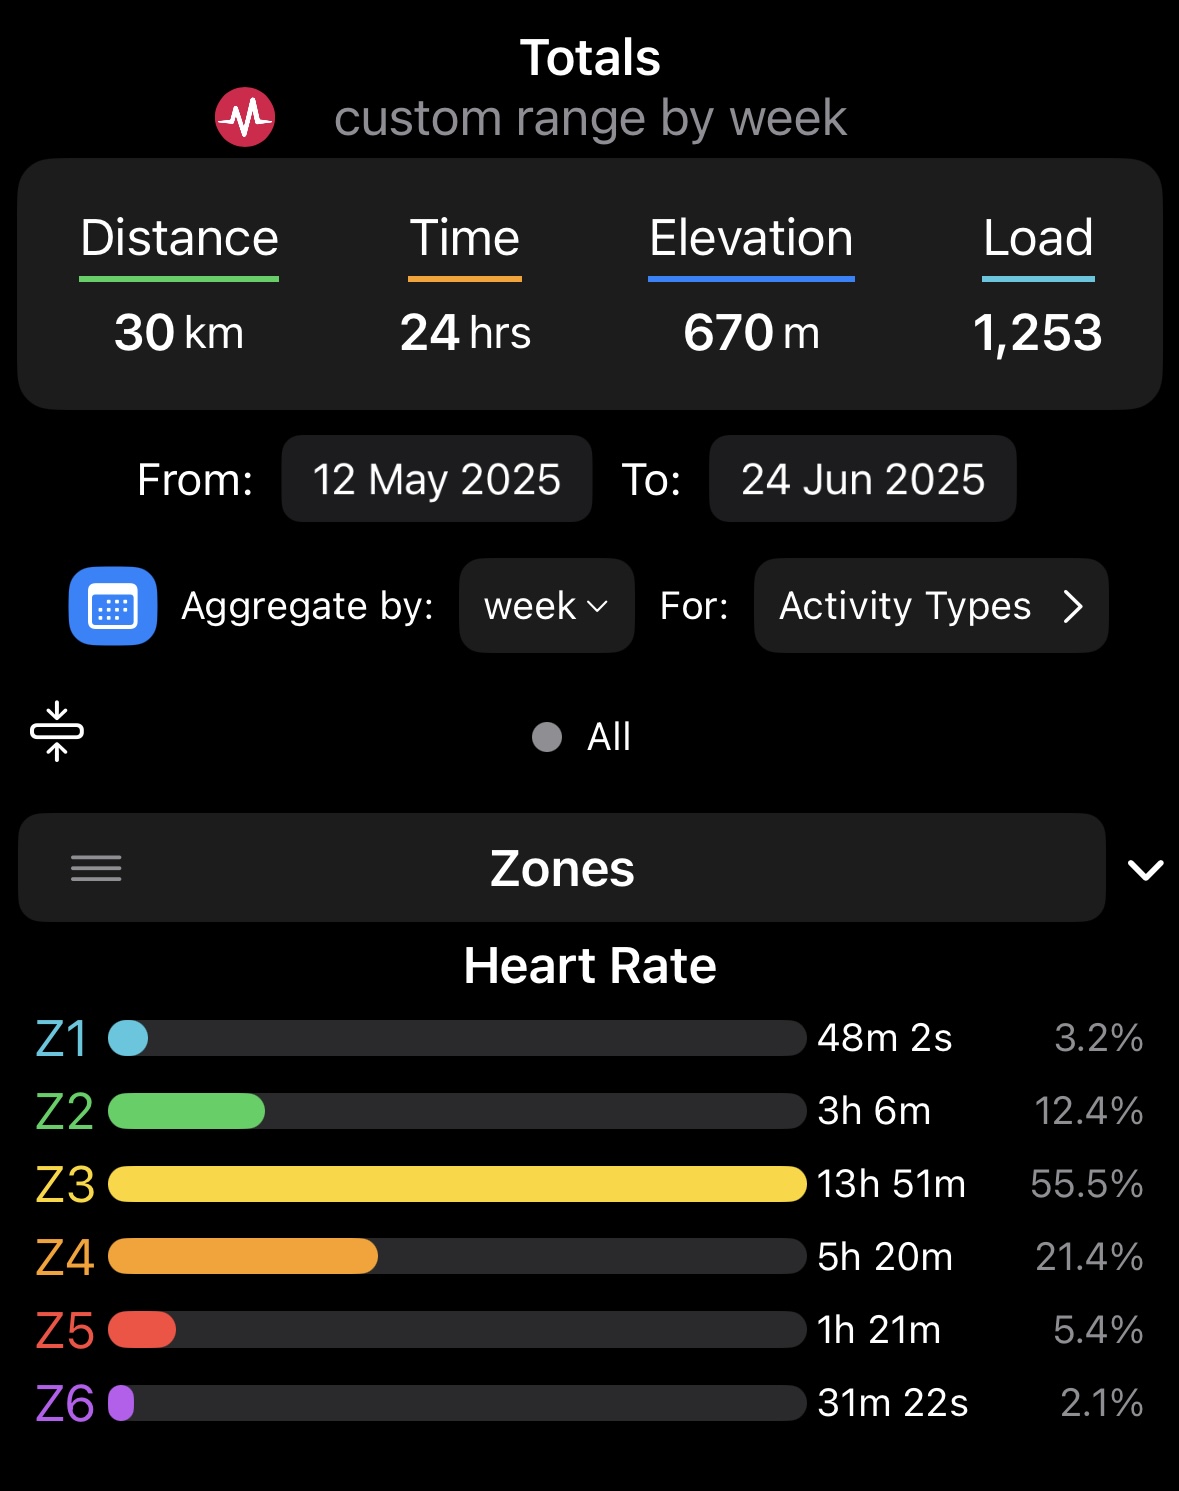
Refreshing after setting custom dates works the way I intended, but agree it may not be obvious behavior.

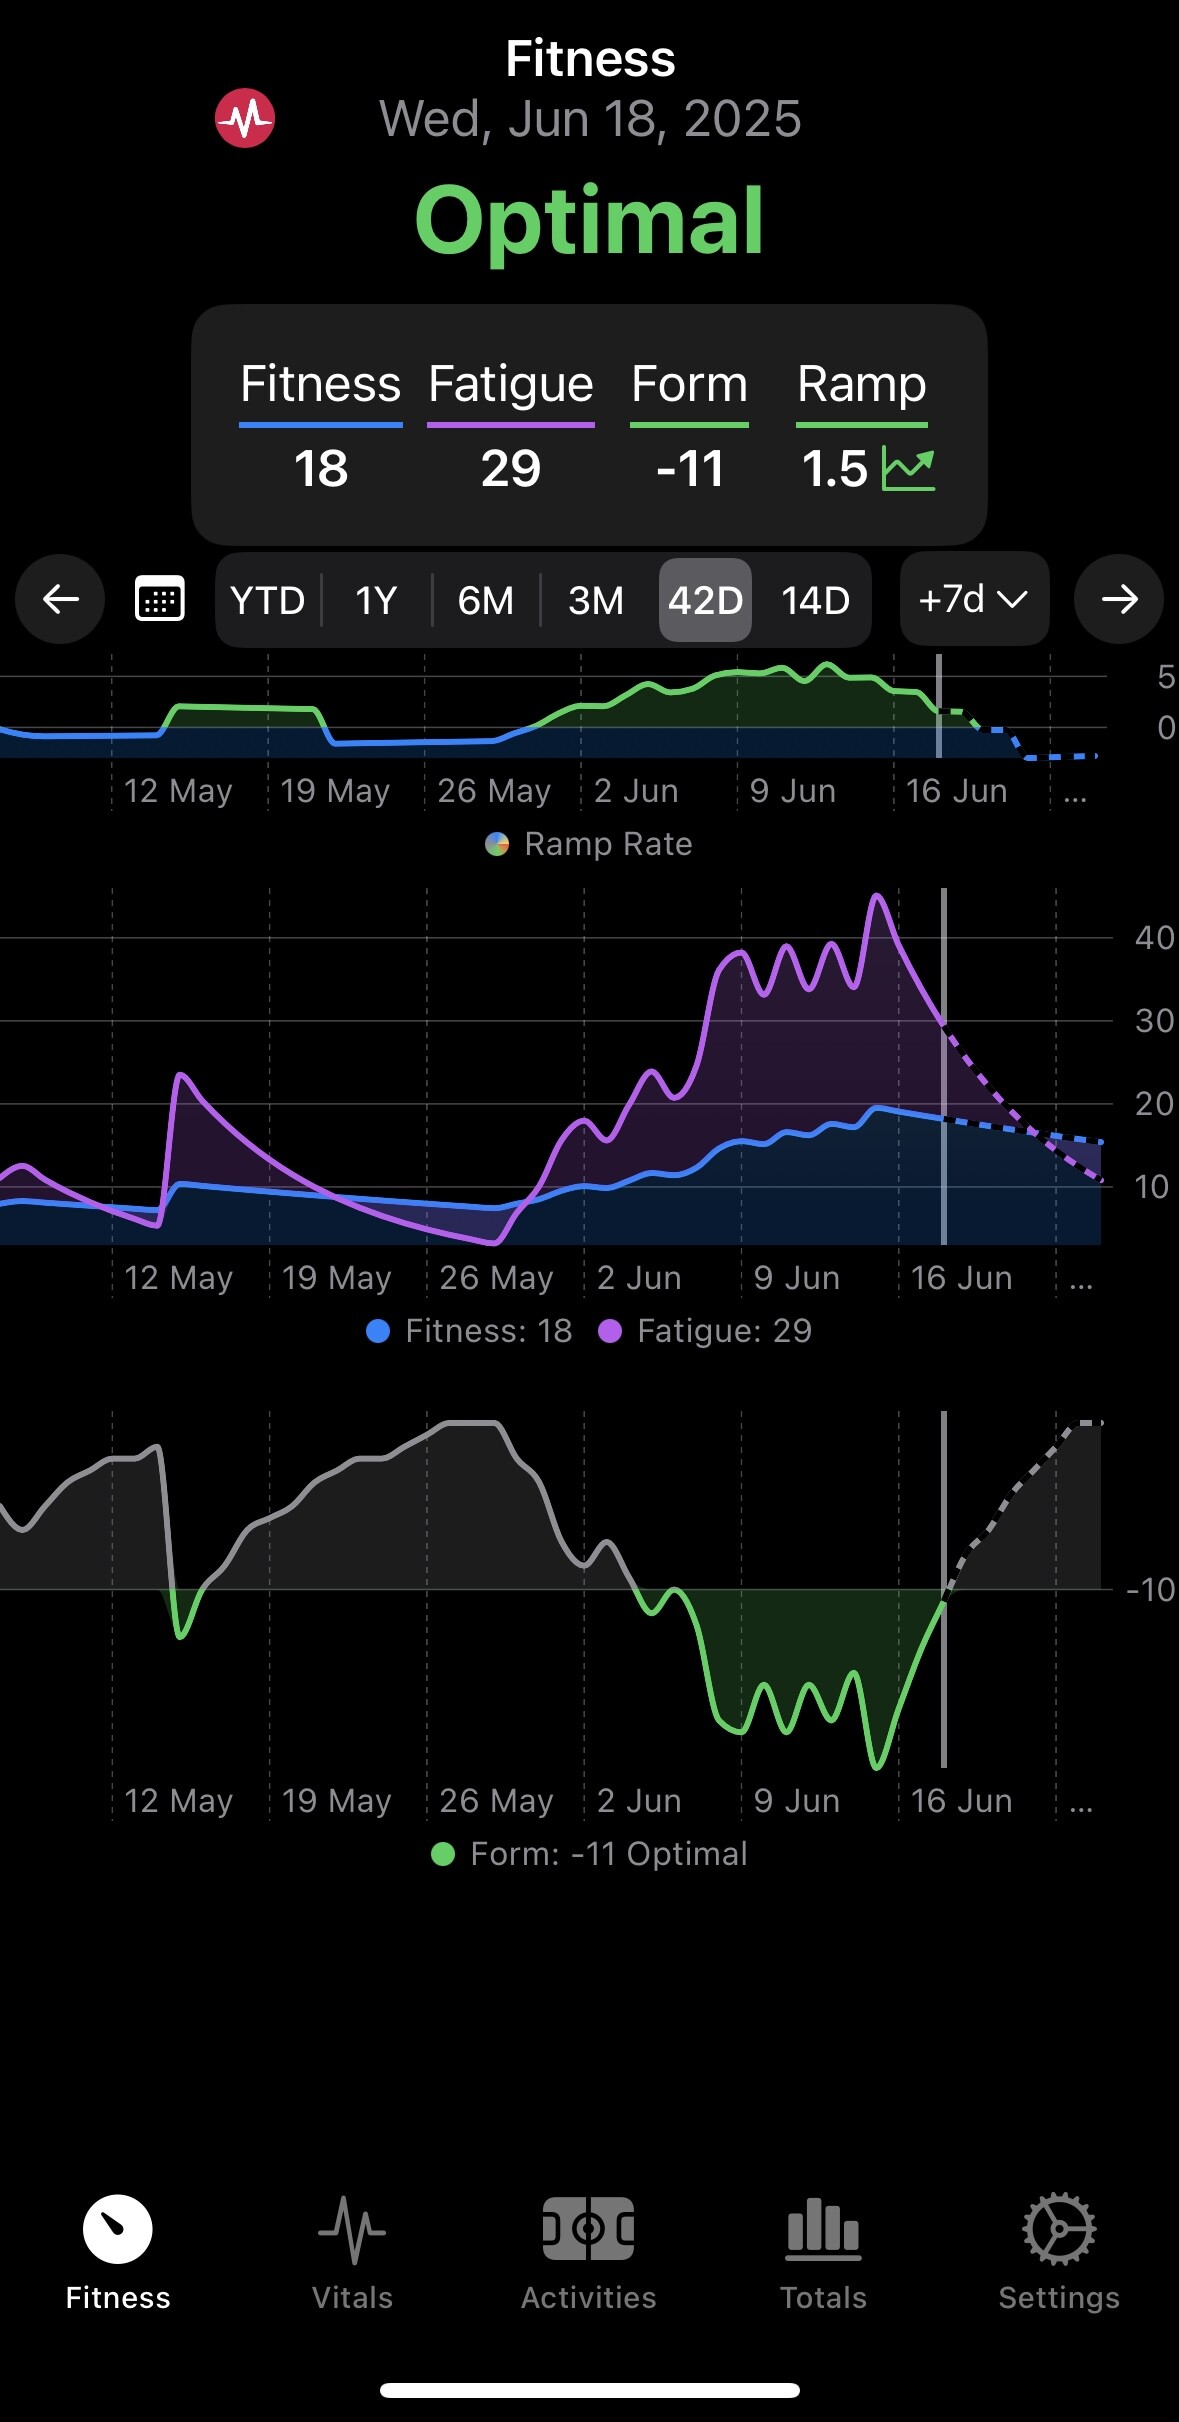
The graph Y axis is a bit strange - sometimes Apple Charts just does what it wants. I do tell it to use a preferred number of axis marks but sometimes it’s like nah.

The Y axis range is is set to the min max range of the data being graphed. Might be able to make that be a user option to change though.

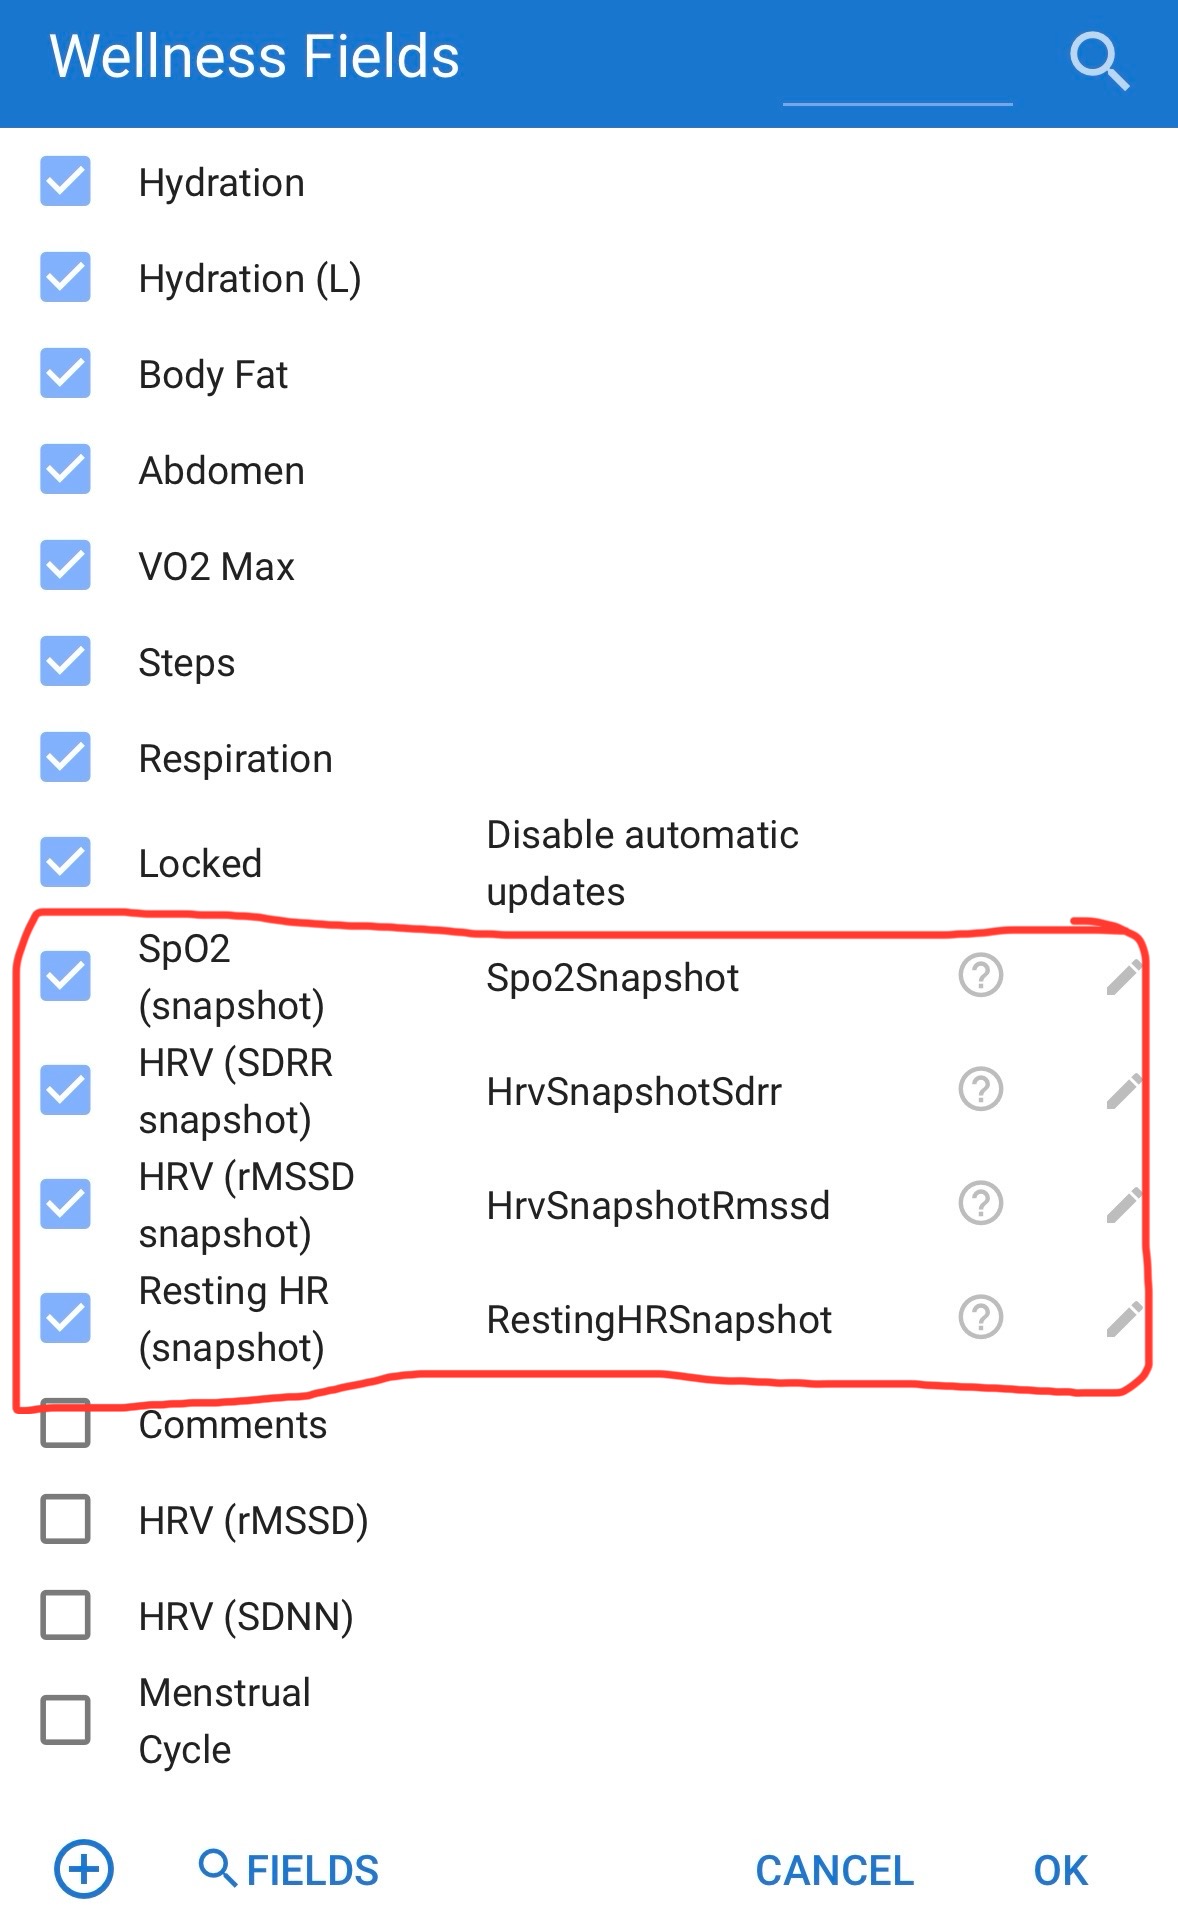
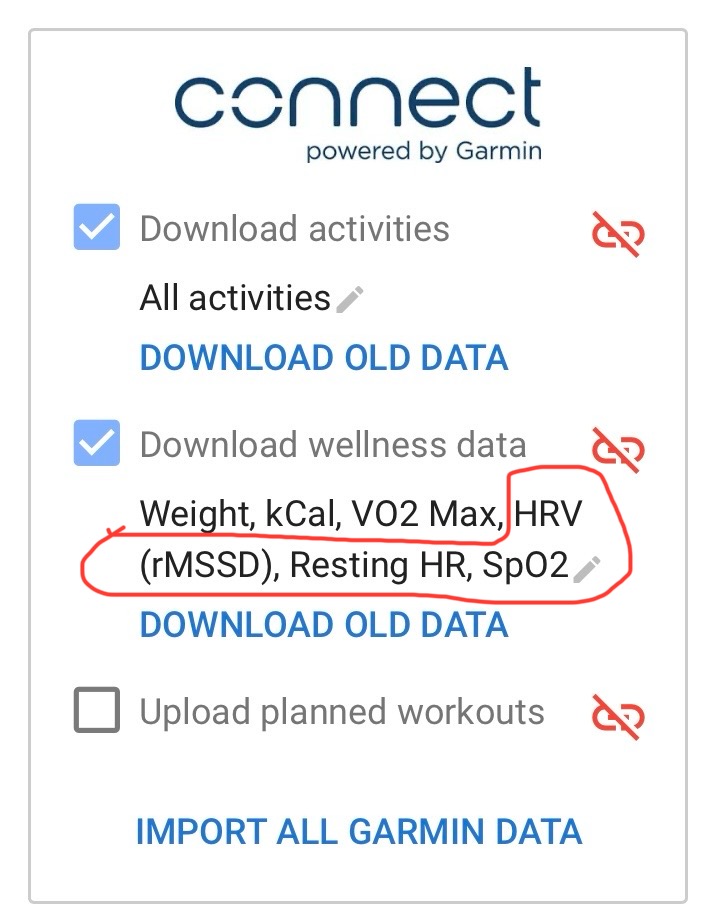
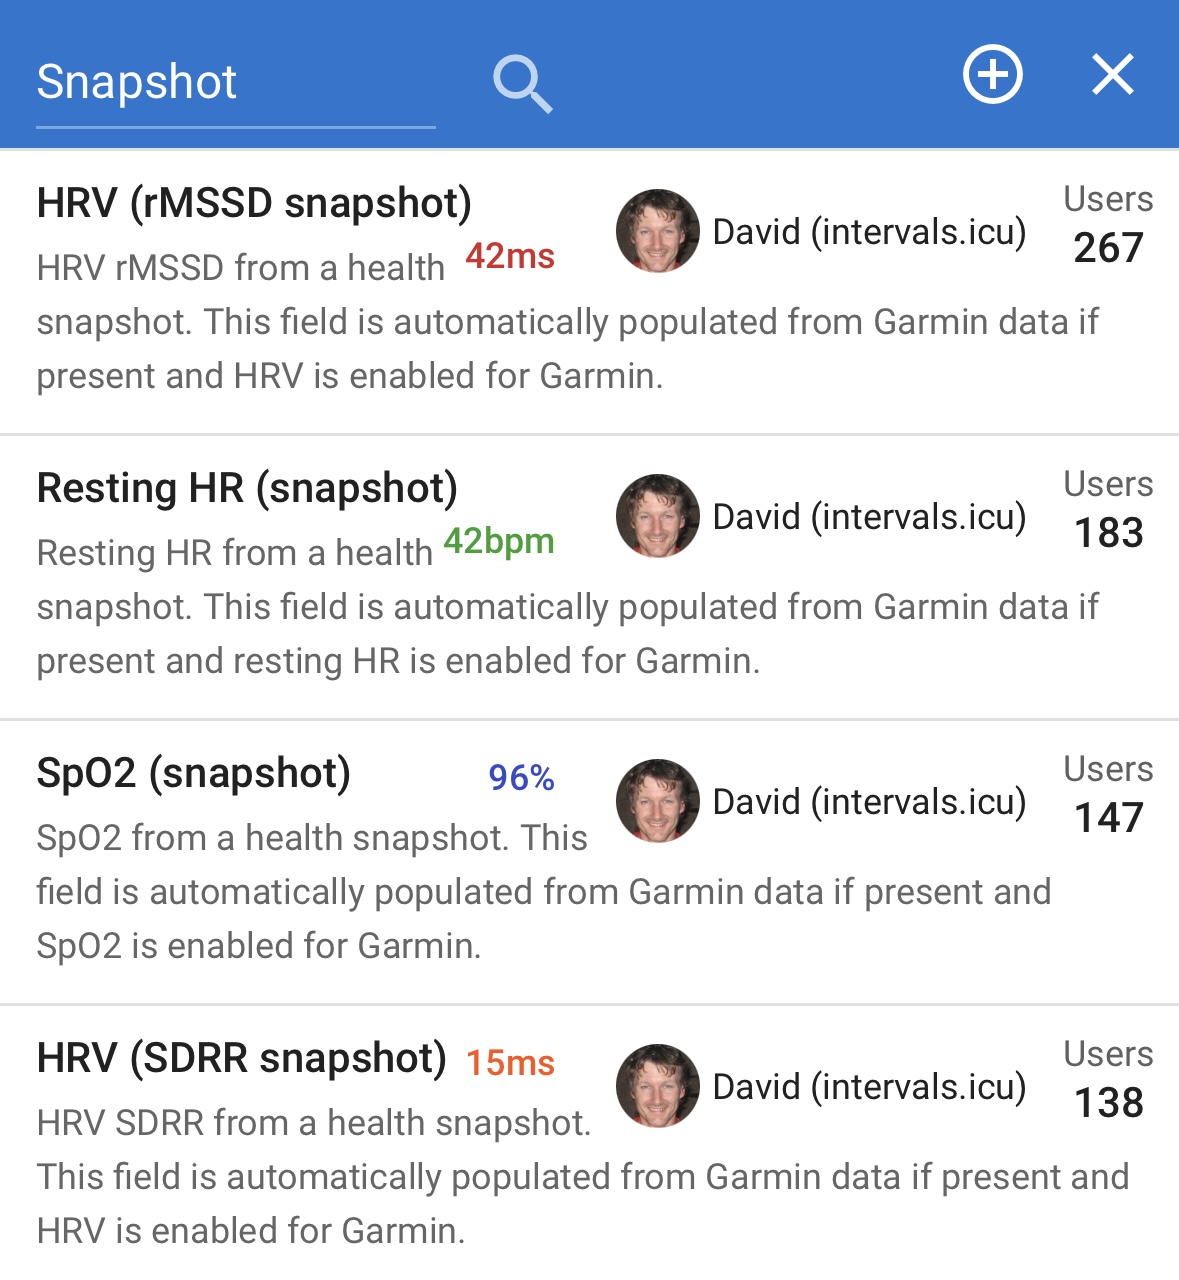
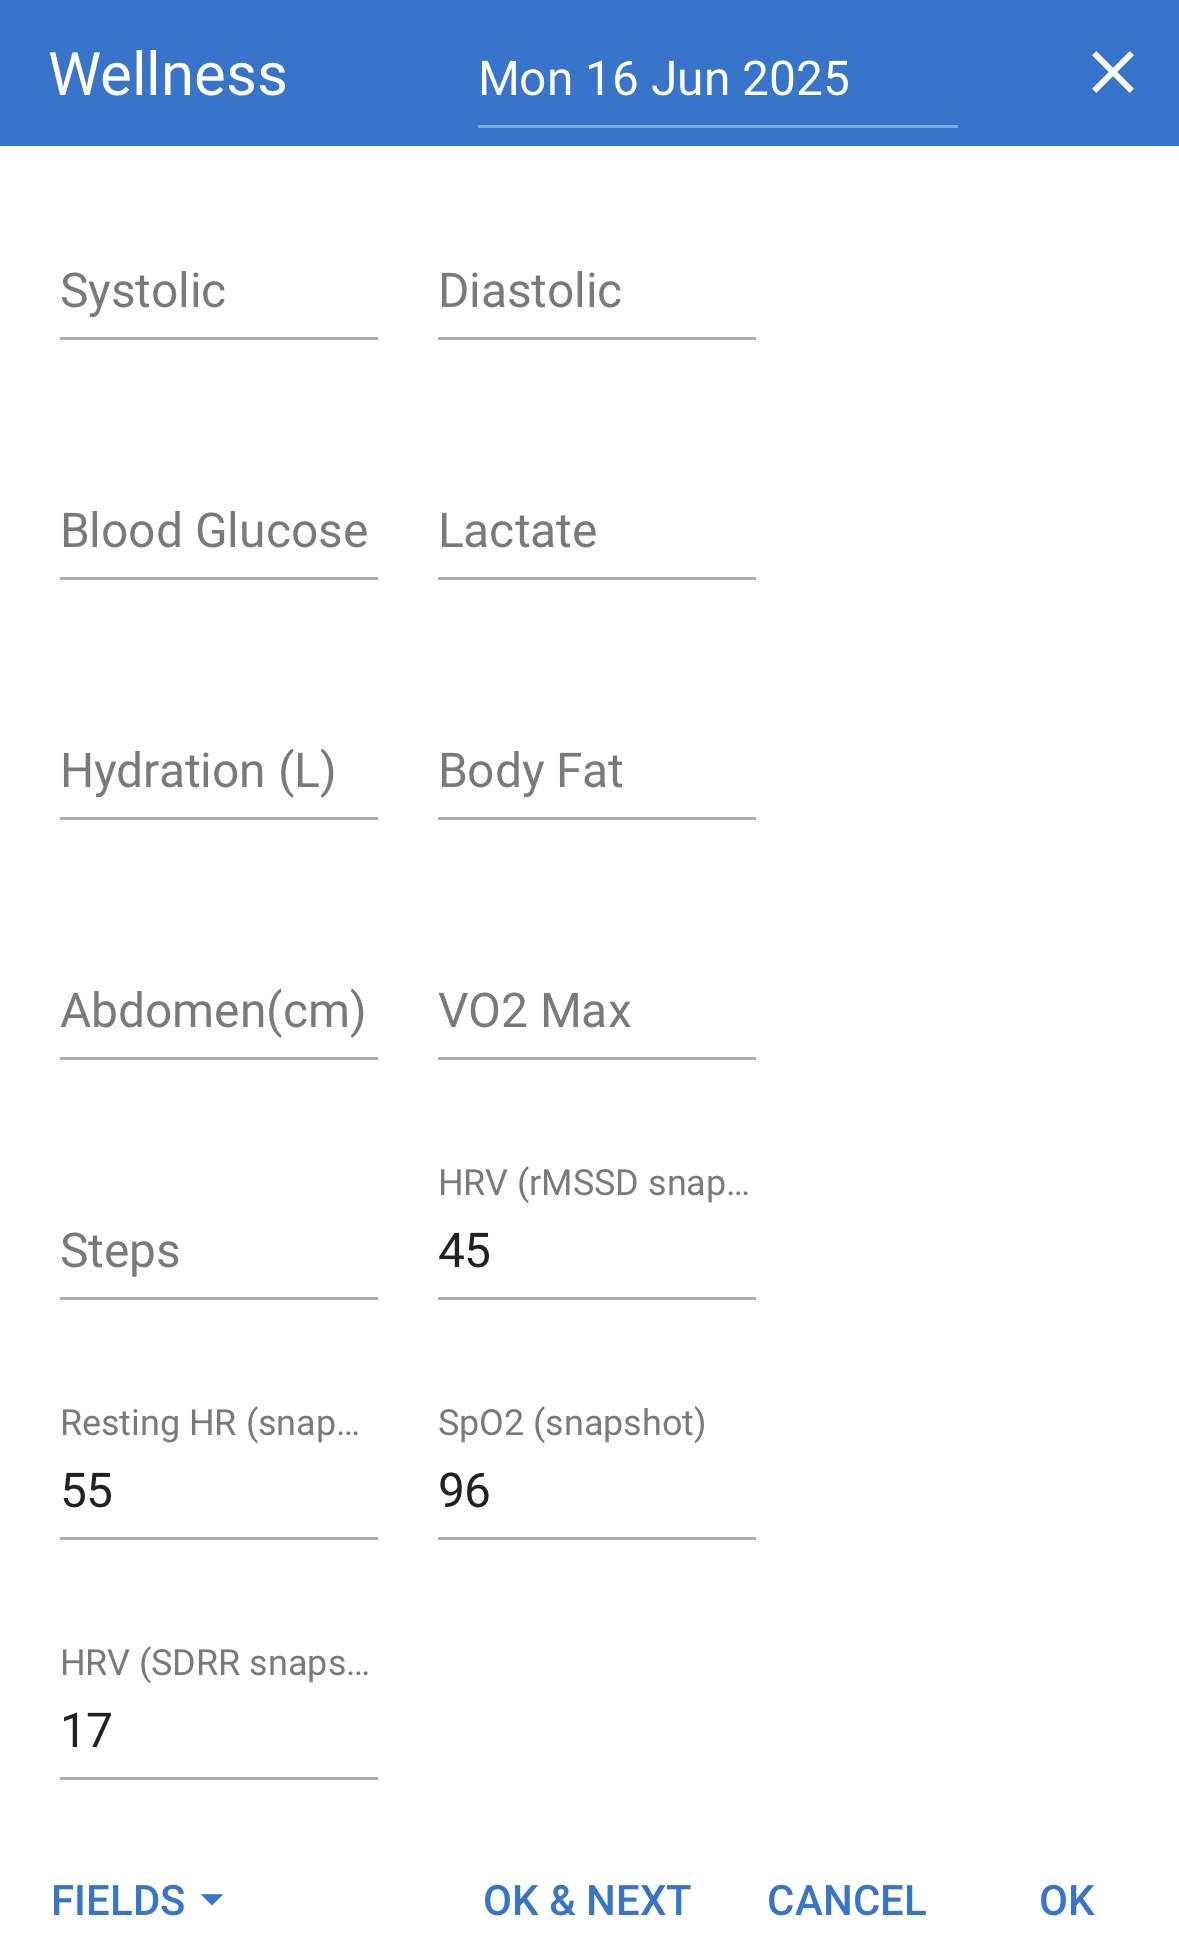
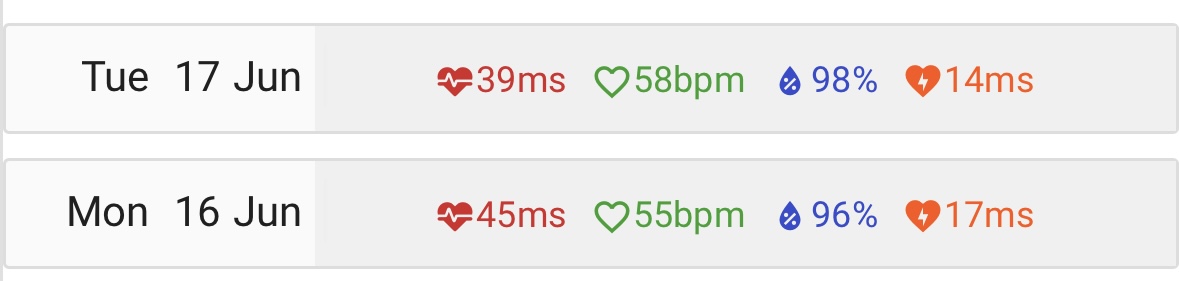
For the Vitals data, I grab specific fields available from the API. I don’t see snapshot fields:

{
 "id": "string",
 "ctl": 0,
 "atl": 0,
 "rampRate": 0,
 "ctlLoad": 0,
 "atlLoad": 0,
 "sportInfo": [
   {
     "type": "Ride",
     "eftp": 0
   }
 ],
 "updated": "2025-06-18T20:31:56.547Z",
 "weight": 0,
 "restingHR": 0,
 "hrv": 0,
 "hrvSDNN": 0,
 "menstrualPhase": "PERIOD",
 "menstrualPhasePredicted": "PERIOD",
 "kcalConsumed": 0,
 "sleepSecs": 0,
 "sleepScore": 0,
 "sleepQuality": 0,
 "avgSleepingHR": 0,
 "soreness": 0,
 "fatigue": 0,
 "stress": 0,
 "mood": 0,
 "motivation": 0,
 "injury": 0,
 "spO2": 0,
 "systolic": 0,
 "diastolic": 0,
 "hydration": 0,
 "hydrationVolume": 0,
 "readiness": 0,
 "baevskySI": 0,
 "bloodGlucose": 0,
 "lactate": 0,
 "bodyFat": 0,
 "abdomen": 0,
 "vo2max": 0,
 "comments": "string",
 "steps": 0,
 "respiration": 0,
 "locked": true
}

For the y-axis, something like -35 to 25 would probably work. But of course the axis would need to self-extend if the data went beyond those boundaries.

Regarding the snapshot fields, I don’t know anything about coding so this will probably sound heaps dumb, but can you just write e.g “HrvSnapshotRmssd” instead of “hrv” in the code and then it magically happens?

Hah! AI makes things easier but it can’t manifest fields that don’t exist. If the fields are not retuned in the data I can’t do anything. Where do those appear on the website?

Y axis can have some better logic so if the bounds are too narrow it will use a larger range. I’m not sure how that will affect the color gradients though. That’s not something Apple does automatically and was quite a lot of effort to get right.

Hi Spencer

Loving the app and donated shortly after starting to use it.

For the last 4 days though the app is not syncing with Intervals.icu. I logged out and back in - no difference. I then deleted the app, re-started my MacBook and re-installed the app. No luck - this week’s activities (showing in intervals.icu) do not show in this app. Same on my iPhone.

Suggestions?

Thanks
Craig

EDIT: Ignore this. Was coming through Strava. The moment I had it coming directly from Wahoo it synced. (Most of my rides come from Hammerhead or Rouvy so a bit different this week.)

1 Like

For the snapshot data, the way it works is you have to have those wellness items selected for syncing…

As well as the custom wellness fields in the activity page…

In which case the snapshot data will automatically go into those fields (or you can enter data into the fields manually)…

And be displayed on the activity timeline…

Does that help at all?

Regarding the y-axis, honestly it’s a pretty minor thing so may not be worth the trouble.

I looked at the API docs and don’t see where these are returned in a format that I can plot them by date. Either I’m missing something or the API doesn’t return them.

I see custom items and the endpoints to manage them. I don’t see anything that sounds like custom items or additional properties being returned by the endpoints I use to get the wellness/vitals or activity data.

Strava strikes again. Glad to hear you figured it out though and thank you for the donation!

1 Like

Ah, OK. Sounds like maybe not possible then. Unless @david knows where to find it.

Small bug: on Totals page, after selecting YTD / MTD / WTD, if swipe down to refresh, all data disappears.

I finally have a rest day from cycling and had time today to take a closer look at the things @tennisninja found - the issues when entering/exiting custom date modes, refreshing, etc. I think I took care of most of them.

Build 1.6.1 build 2 is pushed up to TestFlight and should be available now.

Seems like most of the date related stuff is fixed. But I’m still getting some strange behaviour.

On Totals screen, I select 14D…

Then if I select custom date, with a From date of 12th May or earlier…

And then switch back to 14D by deselecting the calendar button, the result is incorrect…

This doesn’t seem to happen if I select a From date of 13th May or later.

Other than that, I noticed that on the Fitness, Vitals and Activities pages, when switching from picker button to custom range, the custom range still has the +1 day (e.g. switching from 1Y to custom date shows a custom range from 24 June 2024 to 24 June 2025 instead of 25 June 2024 to 24 June 2025. This issue seems to have been fixed on the Totals page only.

Also I can see that the minimum custom range on all pages is still 8 days (instead of 7). Not sure if you intended to change this.

I can’t say that dealing with date boundary issues is my favorite thing to do, but thanks for being thorough and finding these. Your day job must be something to do with software testing?! It seems like this should be simple but there is a surprising amount of edge cases and state to deal with here. I think it’s better now.

Check out the latest build in TestFlight when you get a chance. I’m sidelined a bit so my personal data isn’t great to test with this week, so if you can verify the WTD totals still works that’d be great. I verified the dates getting selected appear correct but I don’t have any data for this week to compare to the website.

Haha, no. This is actually the first piece of software I’ve ever tested so it’s all new to me. My day job is unrelated, but it does require extreme attention to detail so might have something to do with that. Sorry! I had imagined that these sorts of things might be quite tedious to fix, especially as they were not really significant issues. Just thought I should mention whatever I noticed and let you decide what changes to make.

Well, you’ll be happy to know that, as far as I can see, everything is fixed and yes WTD still works and shows the correct result in agreement with the website.

I actually found an issue causing a crash while testing that version on my personal phone so there’s a new build going up. If you’re on 1.6.1 build 6 you will see it if you choose WTD on the totals screen then click the calendar icon. This was happening because I was enforcing dates to be at least 7 days apart, but the WTD range is currently less than that.

I ended up changing the +/- ranges of the custom date selectors, so now the from date just needs to be less than the to date, and to date needs to be larger than from date. Some of the graphs look silly if you choose say, June 23rd to June 24th, but at least it’s consistent. Preventing odd looking graphs was the only reason I originally thought it was a good idea to enforce this.

Tedious yes, but all of this was really good to get sorted out and fixed. I think it’s working better now as a result.

Oh yeah, I see that crash. And yep, fixed in the latest one. But… it seems all the bugs I reported in my second to last post have returned.

The 1.6.1 update is flowing through Apple’s process and should be available. Lots of bug fixes and cleanup to the totals screen. Full changes are:

  • Rearranged totals screen to accommodate new week to date and month to date time ranges
  • Totals screen bug fixes: day range calculation, custom date pickers, and zone totals (all correctly use ignore HR and ignore power options)
  • Consistent loading spinner placement on screen toolbar titles
  • Added heat strain index graph to activity details
  • Added gear reminder reset button to gear settings screen. You must logout and back in again to grant settings:write permissions to the app.
  • WatchOS background task and push notification bug fixes
  • Fixed totals and activities screen layout bugs on iOS 26.
  • Other minor bug and crash fixes
1 Like