Are HR and Z in chart plots the same thing, or are they supposed to be different? As it stands, they seem the same.
I made a chart to document my time in power and HR zones respectively, since HR time in zone is always less than power time in zone (my zones are calibrated to LT tests). The chart plot options include HR 1,2,3,etc. and also Z1,2,3,etc. I assumed that HR and Z referred to power and HR respectively, but they report identical times in the same zones, when this is not the case.
Bottom line: are these two expressions for the same thing?
Correct, …
HR 1,2,3 is time in HR zones 1,2,3.
Z 1,2,3 is the time in Power zones 1,2,3.
It is possible that the two align if zones for each are aligned but they don’t reflect the same thing. Nor are they expressions for the same thing since HR and Power are objective metrics for different physiological systems. Differences in each of the charts are revealed either through more granular (short term) or gross (long term) perspective. I like to use a HR chart that includes multiple disciplines (i.e. swim, bike, run) so that I have a larger, whole organism view of stress. I then use a Z chart for biking only so that I can track and differentiate a more specific system. By tracking both I keep an eye on what system is the weaker and/or more stressed system so that I know which system either needs more work or more recovery.
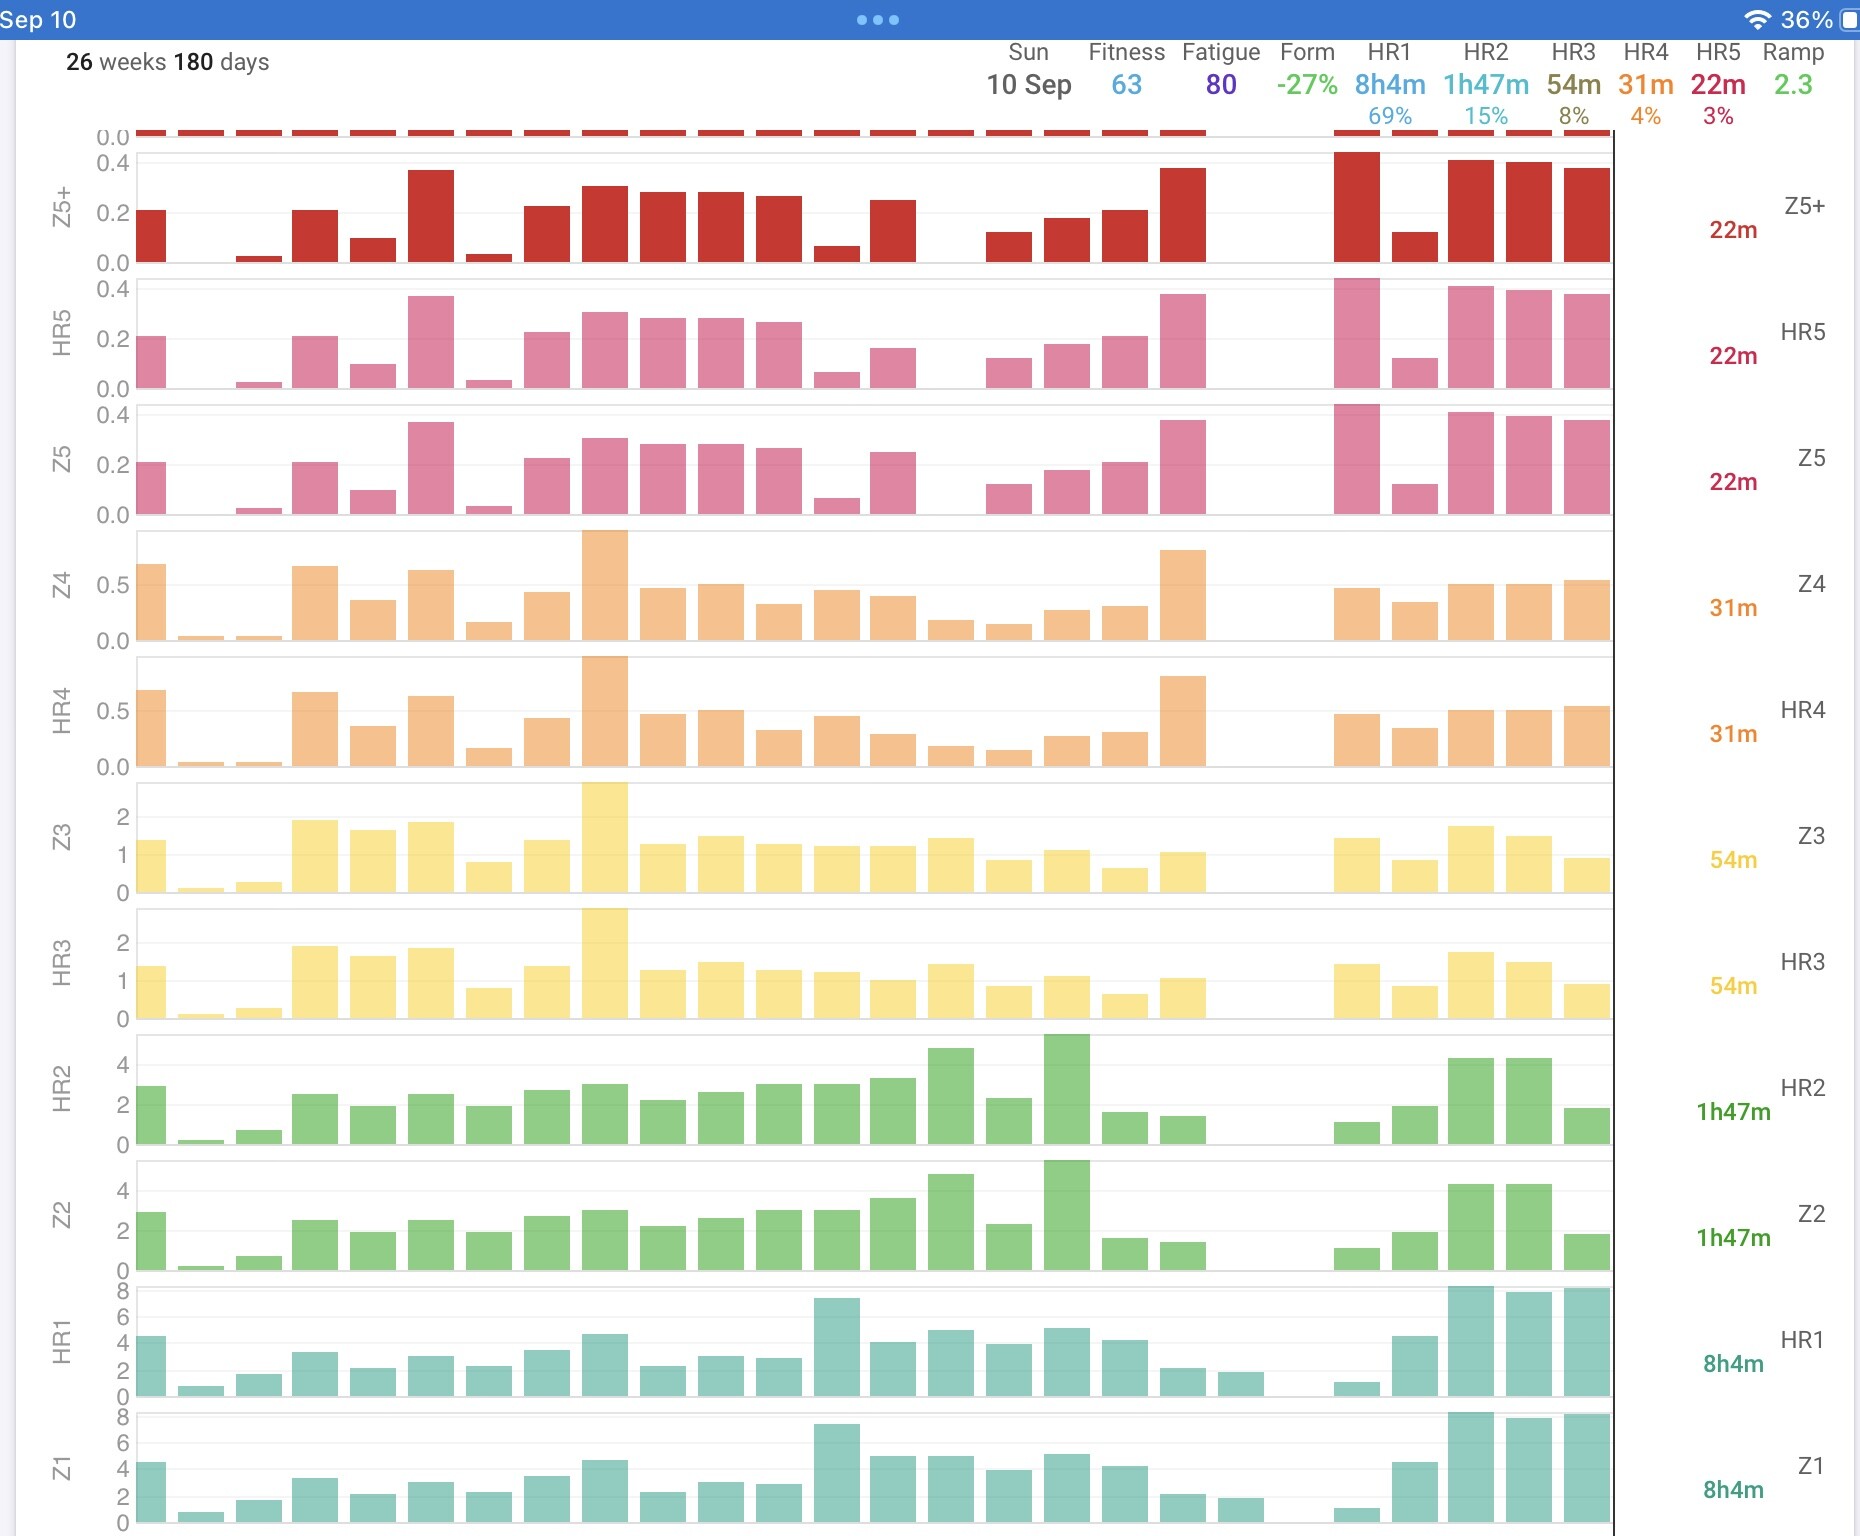
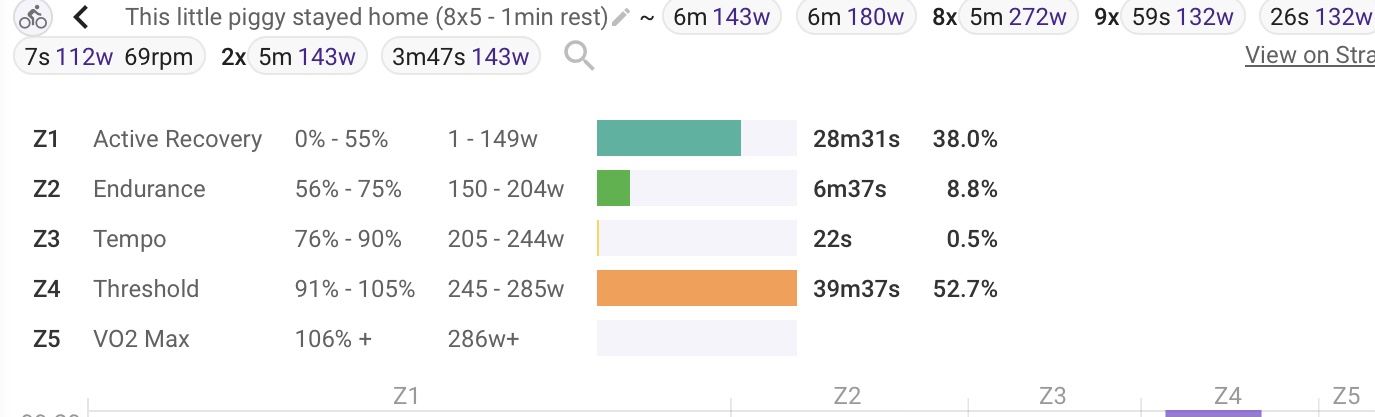
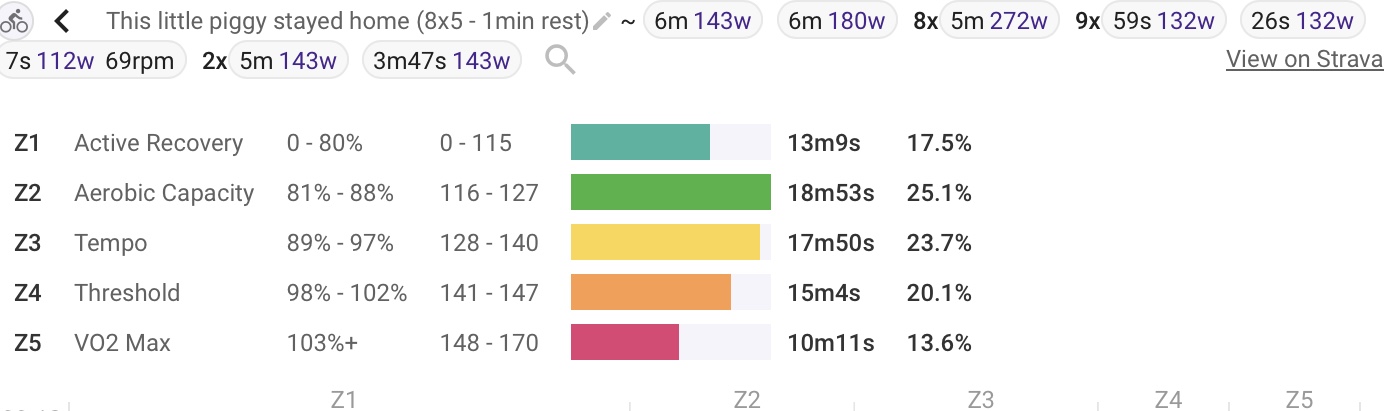
Hey man, thanks for the response. This is what I’d assume, but wonder if I may be missing something. Here’s the basis of my question if the first image, you see a history of weeks comparing each zone by power and HR. They are all identical times (far right in-line), which should not be the case. The reason I suspect this should not be the case is that all of my interval rides have HR lag. So the following two charts show power and hr respectively for the same workout. I’d assume that this difference between hr zone lag zones and power zone would be reflected in the first zone chart. But it does not appear to be. Any insights here?
The Z1, Z2 etc. are usually power zones but if the activity doesn’t have power then they will be HR or pace zones. However this is configured per sport and you have ride set to use HR zones first:
I have power for road rides but not MTB. So this system lets me see overall “time in zones” for the week or whatever when some rides have power and some only HR.
This setting is stored on each activity. If you want to apply a change to existing activities you need to do “Update Activities” in sport settings or “Update Zones” on individual activities.
Hi! I’m fiddling around with this, too. I would like two graphs for my cycling (all cycling activity types included), one that ONLY uses time in HR zones (as far as available) and one that ONLY uses time in power zones (as far as available). In particular, it seems the power graph is adding in HR data for rides that do not have power data (not so much the other way around, because I always have HR data).
Is there a way to make graphs not do that and stick to ONLY either hr or power zones? Thanks!
[EDIT: To clarify my question: I’m talking about graphs for the fitness tab, showing weekly time in zones.]