Zone bars on custom activity timeline charts

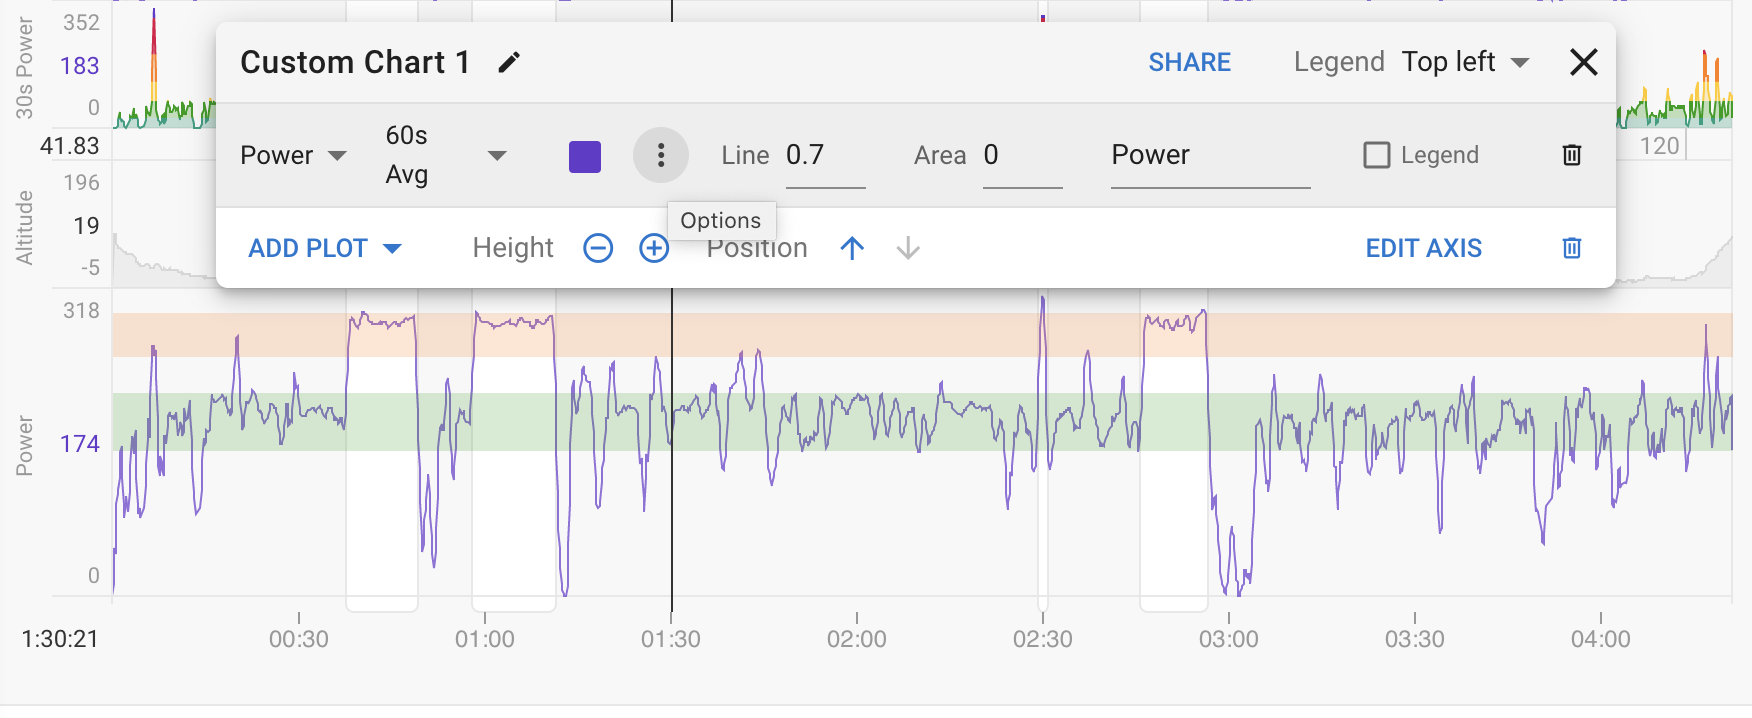
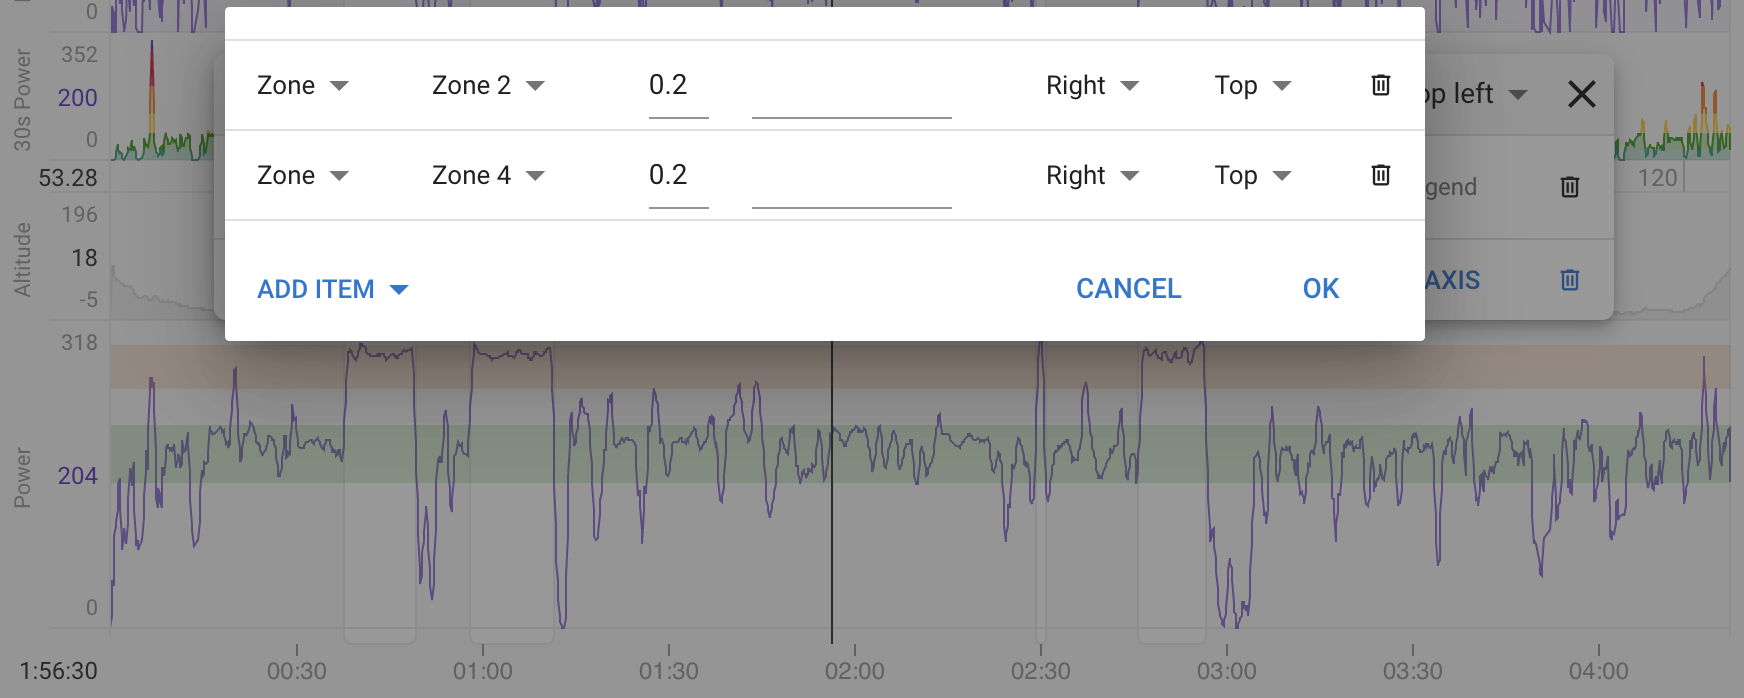
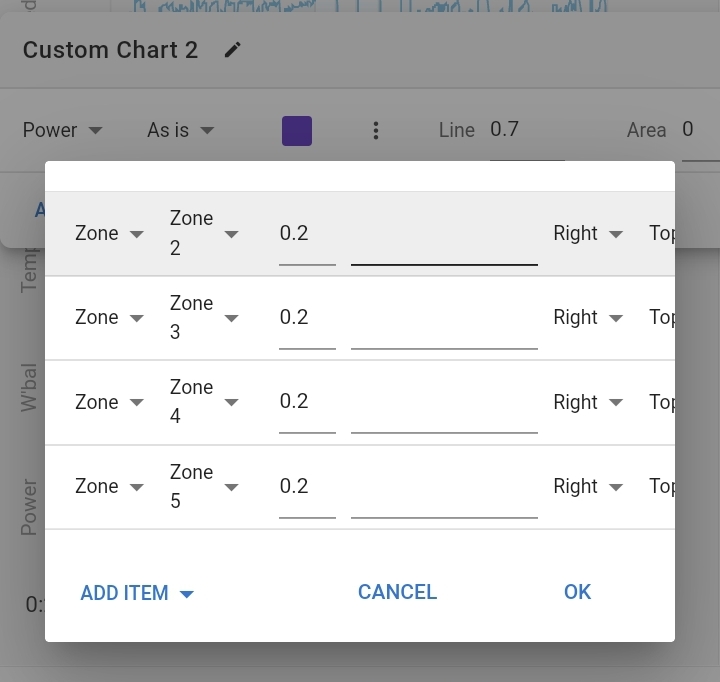
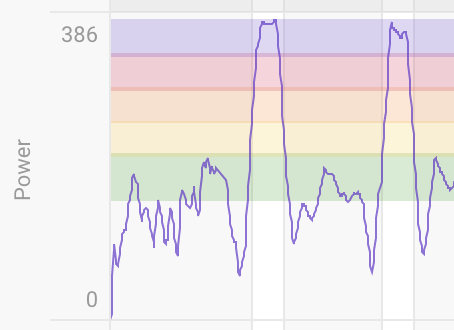
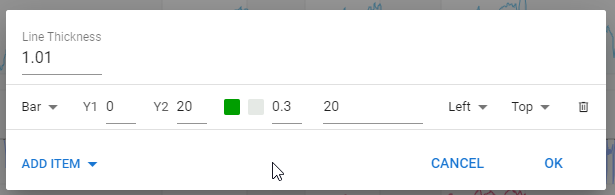
Custom activity timeline charts now support zone bars in the background for the plots. Click the dot dot dot options menu for the plot and add zones. These match the power, heart rate and pace zones for the athlete.

The zone bars also work with plots using percentage scales (e.g. % FTP, % eFTP, % max HR, % LTHR, % HRR etc.).

17 Likes

i tried new zones with power graph but i think the zones are overlapping each other.


Screenshot_20220823-152311_Hermit

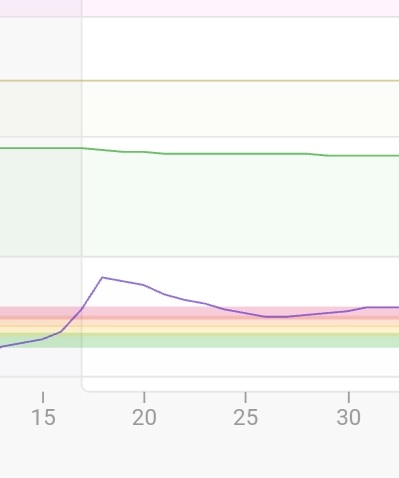
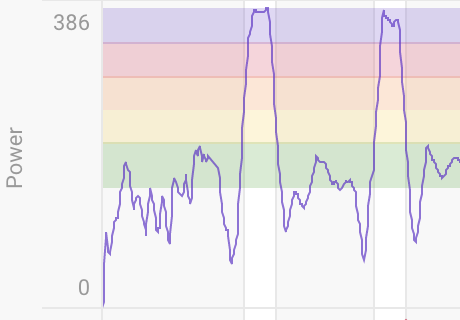
I have removed the slightly darker line around the edge of the zone rectangle. There is still a little overlap sometimes depending on how the rounding goes but it is much less:

Screen Shot 2022-08-25 at 18.55.49

Screen Shot 2022-08-25 at 18.56.19

2 Likes

Hello,

Seems to not working for Speed…

When i put a bar with Y1 : 0, Y2: 20 the zone is over all the speed graph…

image
image

I don’t understand the relation between the data in km/h and the scale of the bar…

I think speed is saved in m/sec.
What if you set the bar at 5.6?
That´s 20k/HR in m/sec.

1 Like

Is there a way to only fill in areas under the line? e.g. copy how the 30s power graph works?

Not currently. That would be nice though.

1 Like