Hi David,
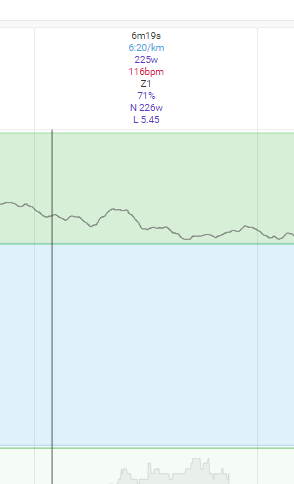
Today I did a recovery run in Z1 (power, with Stryd). The activity page shows my power in the green/Z2 part of the %FTP graph even though I was in z1.
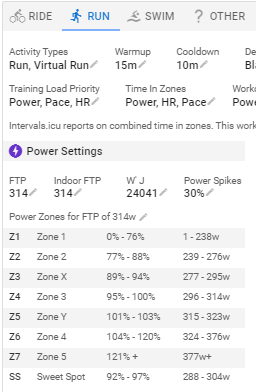
Z1 is 0-238W
I run @ ca 220/230W
and this is my setting
This is the activity https://intervals.icu/activities/i12656662
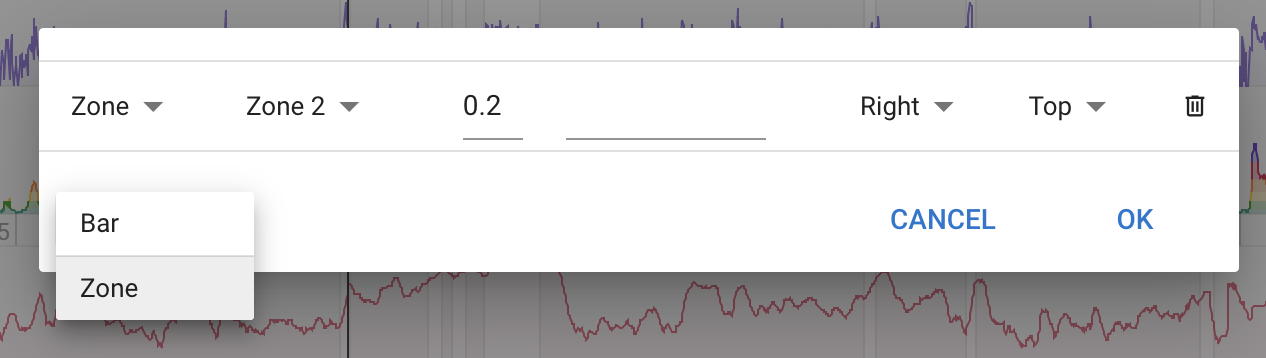
If so the zones in there are probably hard typed so you’ll need to adjust them manually.
Click the y axis label to edit the chart in question, then click the 3 dots to the left of line and edit the Y1 and Y2 values to match your zones? Might be worth duplicating to have for for each sport if your zones vary