Wind Impact on Cycling

now that we ahve all those fancy Wind data, I will be very cool to transform that in felt elevation while cycling, there is a web site called windsock thay does something lik that , I am interested becasue I live in a extemely windy place where cycling with 12-17 knots sometimes in the norm.

I hove find a bit of math around the web :
Formula for Wind to Elevation Gain:

Elevation Gain = {K * [(Vr + Vw)^3 - Vr^3] * d} / ( m * g * Vr )  

Variables:

  1. k : Aerodynamic drag constant, approximated as:

    k = 1/2 * Ad * Dc * A
    • Ad : Air density (~1.225 kg/m³ at sea level)
    • Dc : Drag coefficient (~0.88 for a typical cyclist)
    • A : Frontal area (m², ~0.5 for a typical cyclist)
    

k is typically around 0.2–0.3 for most cyclists in real-world conditions.

  1. Vr : Rider speed in m/s.

  2. Vw : Wind speed in m/s (positive for headwind, negative for tailwind).

  3. d : Distance ridden in meters.

  4. m : Total mass of rider and bike in kg.

  5. g : Gravitational constant, 9.81 m/s².

Simplification for Practical Use:

• Use a default value of k approx 0.25 unless you have specific measurements.

• Convert Vr and Vw from km/h to m/s by dividing by 3.6.

Example:

A cyclist:

• Mass ( m ) = 90 kg (rider) + 10 kg (bike) = 100 kg

• Speed ( Vr ) = 25 km/h = 6.94 m/s

• Wind speed ( Vw ) = 10 km/h = 2.78 m/s (headwind)

• Distance ( d ) = 10,000 m (10 km)

  1. Calculate the power effect:

Power = k * [ (6.94 + 2.78)^3 - 6.94^3]
Using k = 0.25 :

Power = 0.25 * [ 9.72^3 - 6.94^3] = 0.25 * (918.99 - 334.38) = 146.15 W

  1. Convert to elevation:

Elevation Gain = (146.15 * 10,000)/(100 * 9.81 *6.94)

Elevation Gain =~ 214m ( fixed typo )

This means a 10 km/h headwind over 10 km at 25 km/h feels like climbing an additional 214 meters of elevation.

You can use this formula to estimate for different conditions. Let me know if you need specific help calculating for your scenario!

possibly these can be graphed for an activity and have have that as a delta pplied to the elevation graph

here the page to that service I was mentioning
https://mywindsock.com

4 Likes

Thanks very much for this info. I am going to see what I can do with this when I get a chance. You could create a custom activity stream to compute “feels like elevation” using the apparent_wind_deg, wind_speed, altitude and velocity_smooth streams.

3 Likes

that would be fun to see, as its both very flat and very windy here:

huge speed differences depending on the direction I’m traveling.

1 Like

Hi. I don’t know about the formulas (formulae?) so I don’t know what’s wrong, but working through your example I get 214m, not 21.4m. Hope that helps.

2 Likes

that might be a typo… 21m over 10Km with 25 Km/h of wind seems to low

1 Like

I also got 214m using the parameters listed in the example. If the calculation is accurate, I’ll apply it to some local roads/rides and see how it translates. Thanks @Sapo74
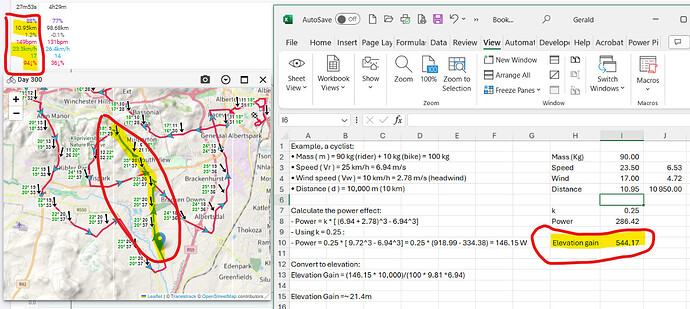
image
image

1 Like


A ride with 95% headwind, gives a 544m elevation gain over 10.95%, making it a 4.95% gradient.

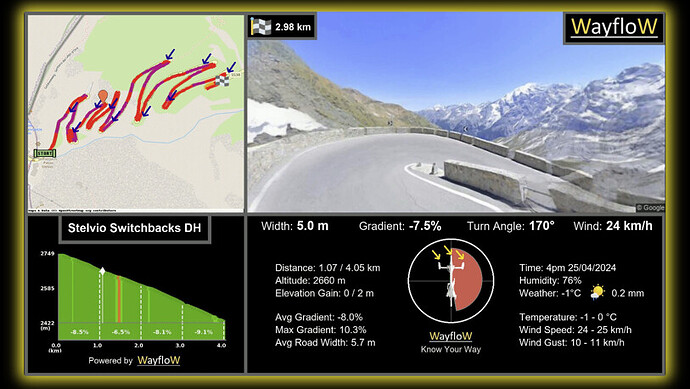
A club mate share this link to a system the WT teams can use.

https://blog.veloviewer.com/wayflow-x-veloviewer-collaboration/?fbclid=IwY2xjawGtMp5leHRuA2FlbQIxMAABHYPjLYfqlUyAdaiDMrigTJIjbI2Lar5uMZohYGnhO6ZTP2W0Tvh6P8hNoQ_aem_F_t31MlKN6dDbMYEPwnKvA

2 Likes

I would guess from the “Let me know if you need specific help calculating for your scenario!” bit that this is from ChatGPT.
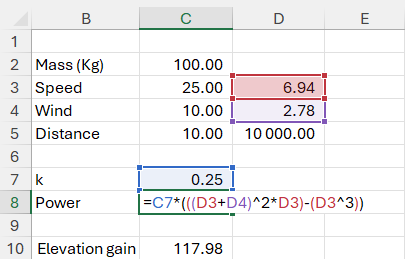
I think it might have made a mistake. What it seems to be doing is calculating the power needed to overcome wind resistance as K * [(Vr + Vw)^3 - Vr^3] but I think this should actually be K * [(Vr + Vw)^2*Vr - Vr^3]. For the rest it seems okay (it converts the power to work by multiplying by d/Vr (i.e., the time spent riding) and then divides by mg to get the equivalent elevation gain for that much work).

One way you can see that this formula must be wrong is that it predicts that you’d be doing work if you’re standing still in a headwind. The formula should approach 0 as Vr approaches 0, but it doesn’t.

2 Likes

I have run some tests with your fix and it seems to work better

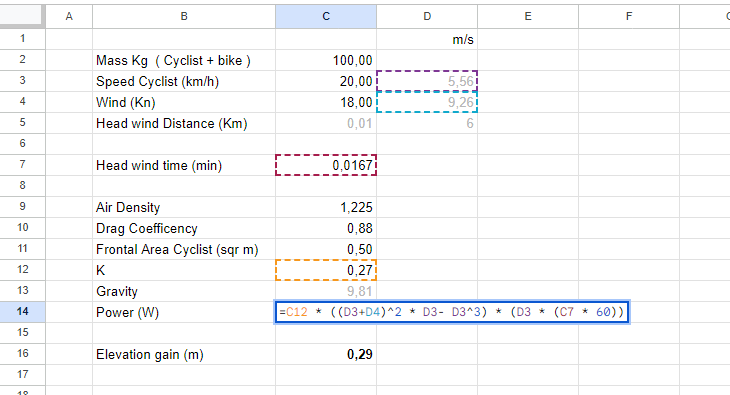
so by cycling for 1 second head wind at 20 km/h , with a total mass of 100Kg in a 18Kn wind is like going up of 29cm each 5.56 meters that should be like climbing at 5.22 %

I’d love the be able to graph the “felt” elevation and “felt” % and compare with the “real”

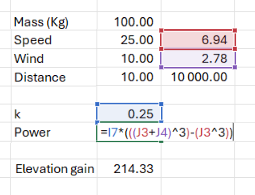
@Sapo74 Please can you confirm the formula is correct, i.t.o. terms, bracketing, expressions, etc.
image

in my spreadsheet I have less brackets but shod be the same
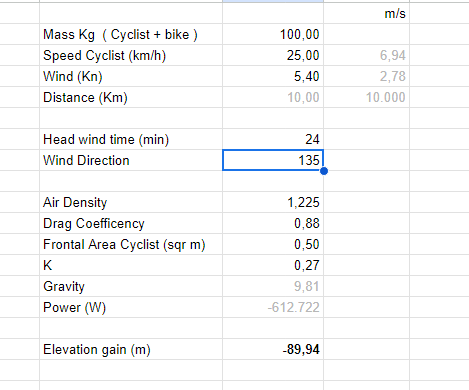
POWER = K * ((Vr+Vw)^2 * Vr - Vr^3)

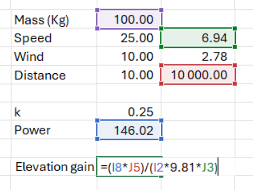
but then you have to mult but the distance so

POWER = K * ((Vr+Vw)^2 * Vr - Vr^3) * DistMeters

disance is headwind time * speed

1 Like

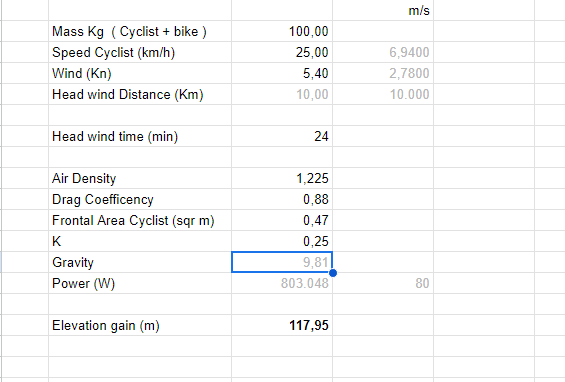
this is using your data
image

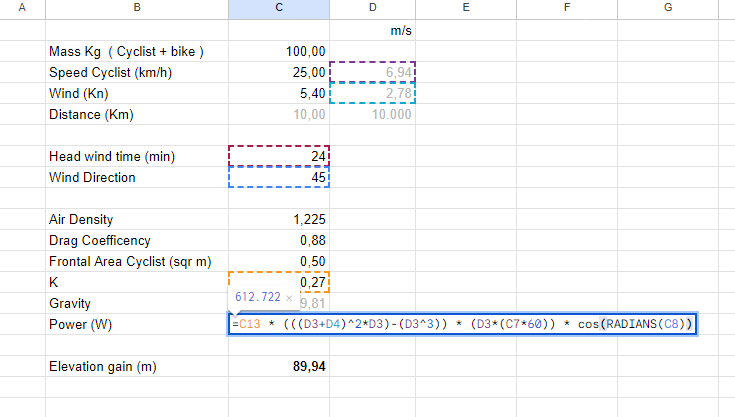
now that works for head wind and tail wind, Intervals.icu gives total time of head wind and tail wind in the activity and so far I have used that in my spreadsheet. need to be done some implementation based on wind direction, something like

Power * Cos(windDir)

in this way the effect will be 0 for side wind, feel like positive elevation for head wind and goinf down hill for tail wind

and with a bit of tail wind
image