Hello David,
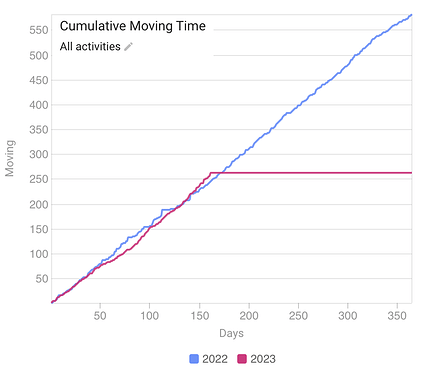
I setup graph to compare 2022 vs 2023. Just a basic volume comparison graph.
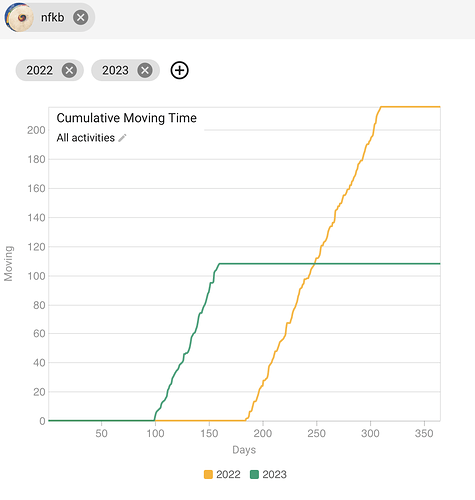
I choose the cumulative moving time graph. And I’ve got weird results, with big periods without activities despite a lot of activities uploaded to intervals.icu
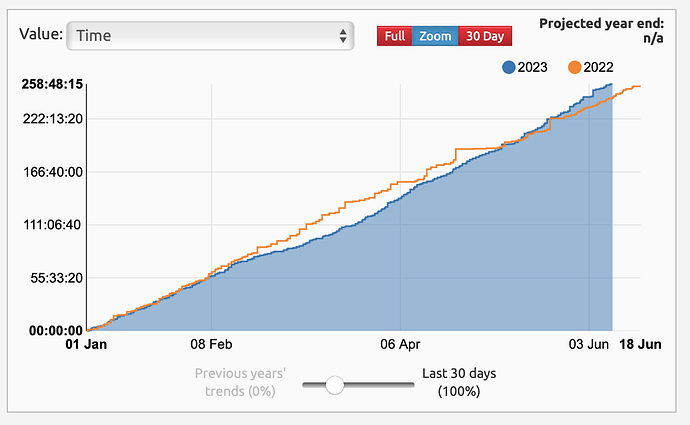
vv gives me :
Is there something I can do to improve the i.i graph please ?
Thank you


