Weekly classification question

Hi @david I’m bit confused with who classifications actually works.
See, two weeks ago I had this one (Pyramidal):


while Threshold one shows much time in Z2-Z3.

This week I received Threshold but it looks similar to Pyramidal (at least on a graph):

I wonder how it really classify weekly load. Does it take only power data or some specific how actually hard you rode (as I did 2 VO2max interval sessions this week)…?

Thanks

It just looks at the ratios between time spent in the 3 zones (s1=z1+z2, s2=z3+z4, z3=z5+):

if (s3 > s2 && s3 > 0.499 * (s2 + s1)) ans = HITT
else if (s3 > s2 && s1 > s2) ans = POLARIZED
else if (s1 > 3.99 * s2 && s1 > 3 * (s2 + s3)) ans = BASE
else if (s1 < 3.01 * s2 && s1 > 1.4 * s2 && s2 > 1.4 * s3) ans = PYRAMIDAL
else if (s1 < 4 * s2 && s2 > 0.5 * s3) ans = THRESHOLD
else ans = UNIQUE

So you can see it will pick threshold over pyramidal if each step up isn’t at least 40% more than the one below.

2 Likes

I’ve been confused by this as well. I’ve just compared two time periods:
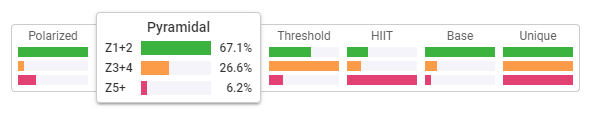
Example 1
image

Example 2
image

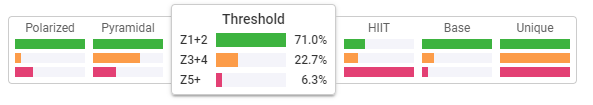
Even though S2 (Z3+Z4) is emphasized less in Example 2 its classified as Threshold.

With the code you posted - is the logic for deciding if it’s Pyramidal correct? The higher S1 (Z1+Z2) is the less chance it has of being classified as Pyramidal.

It looks like the s1 < 3.01 * s2 PYRAMIDAL check could be wrong to me.

Have to ask @fastfitnesstips about that :slight_smile: I adapted one of his spreadsheets for the classifications.

Per a related discussion on the TrainerRoad forum, I am suggesting an altered display to make the comparison more clear, and maybe help correct poor classification along the way.

Below is a full list of the default classes, with the “weekly class” shown below, under the one that the app links. In the TR case, Threshold is selected and shown, but as you can see, it is likely not the right/best comparison. The week shown should probably be Base or Pyramidal, but definitely not Threshold.

Weekly-Classes

4 Likes

Hmm. You have a good point. I have added re-looking at this to the todo list. If anyone has any references to ways of doing this sort of classification please post them on this thread.

1 Like

Another data point of an issue I noticed today. Did a mini mini accidental sprint in the middle of a Z2 ride, ICU marked it as “Polarized”. Didn’t know it’s that easy to do polarized training :smiley:
I realize these are probably quite annoying to code right when you get to edge cases. polarized

1 Like

I’ve always thought that the distribution chart should only be relevant to the date range selected at the top.

The fact it shows the latest workout is rather confusing. I would simply remove the last workout display and link it to the selected date range.

The distribution chart is totally meaningless per workout. It’s really only useful for extended training periods.

For example, there is no such thing as a ‘polarized workout’. Polarized training is time in zone over an extended period. Weeks, months etc.

This needs a re-think.

2 Likes

Ok, help me here please. I am new to Intervals.icu. i have a few newbie questions (Sorry, but i was not sure how to put in meaningful searches to find the answers)

  1. I was looking at the Totals page, and trying to work out what the actuak ratios of each time in zone are that determine whether the classification is Pyrimid, Threshold, Polarized or whatever. Watching the FFT video did not help because that was still talking about days and not time in zone. Also it did not clarify the precise lines between each type. That was the start of this search.

  2. @ David Your post above provide a set or rules, which i can make sense of, so thank you. @Chad_McNeese are these rules consistent with what Amber describes in her excellent video (299 I think), when she described the research and variety of definitions of the various mixes of training zones?

  3. Does this classification apply to the Date range chosen above? I assumed it does because changing teh date range can change the classification. However @The_bandit says it is only the most recent ride (which seems pretty pointless)

  4. I asked (3) because the @niklas post says he saw a ride classified by intervals.icu. I have looked at my rides and see no such classification? How do I see that? (Do I use this same Totals. but simply zone it down to a single day?

Thanks in advance for help to a Newbie :slight_smile:

There is some more info in this thread:
https://forum.intervals.icu/t/mapping-7-zone-to-3-zone-model-wrt-polarized-training/3090/51
Your 4th point:
image
Click on “Polarized” or whatever classification shown in the activity page to bring up this:

1 Like

Welcome!

Yes it does apply to the whole date range selected. If you click options and turn on “Show watts” and/or “Show HR” the the watts and/or HR numbers shown on the chart are from the zones for the most recent activity in the date range. You zones may well have changed during the time period. Each activity gets its own copy of the zones with time in each zone etc… So the totals are good, it’s just the watts/bpm numbers that reflect the most recent activity.

Thanks David

@david - there’s still a bug with how TiZ is classified:

I’ve seen a few examples of other people getting confused with the classifications as well (in discussions on the TrainerRoad forum etc.).

As posted last year, from looking the code snippet you posted I think the fix could be as simple as correcting the logic for the Pyramidal check:

Hmm. It doesn’t help that there are no “standard” definitions for the training distributions. If your s1 is very much more than s2 are you really doing pyramidal? I could tweak it a bit. Any suggestions?

I think the biggest problem at the moment is that the more Z1+Z2 you do, the more likely it is to classify it as Threshold (which can’t be right):

image
image

I’d personally say a split of 74.5% / 21.7% / 3.8% should be either classified as Base or Pyramidal, but definitely not Threshold.

I’m not sure what the exact thresholds should be between the different classifications, but fixing the Pyramidal logic would improve it.

Ok I have tweaked it a bit:

if (s3 > s2 && s3 > 0.499 * (s2 + s1)) ans = HITT
else if (s3 > s2 && s1 > s2) ans = POLARIZED
else if (s1 > 3.99 * s2 && s1 > 3 * (s2 + s3)) ans = BASE
else if (s1 > 1.4 * s2 && s2 > 1.4 * s3 && (s3 /all) >= 0.05) ans = PYRAMIDAL
else if (s1 < 4 * s2 && s2 > 0.5 * s3) ans = THRESHOLD
else ans = UNIQUE

So for PYRAMIDAL s3 must be at least 5% of the total and each easier zone at least 1.4 x the one below it. Looking at my own data this did convert some threshold classifications into pyramidal, correctly IMO.

1 Like

Has the change been deployed?

Yes but you might need to reload the app to see it.

Sounds like a step in the right direction, but still classifies this as Threshold:

Thats because of the 3.8% in Z5+. That needs to be at least 5% with the new formula. I could drop that to 3% …

I Googled a bit more and found this: Polarized and Pyramidal Training Intensity Distribution: Rel

Therefore, the aim of the present study is to relate training intensity distribution with performance during a Half-Ironman race in two groups that followed two different training intensity distributions: “polarized” 84.4% / 4.3% / 11.2% distribution and “pyramidal” 77.9% / 18.8% / 3.3% distribution of total training time for zones 1,2 and 3, respectively.

So maybe 3% is good. I will change it quick …