Having issues accessing intervals.icu site last several days.
Most of the time it does not load at all. But when it loads, it appears to work fine.
This is like subset of servers behind load balancer are not healthy.
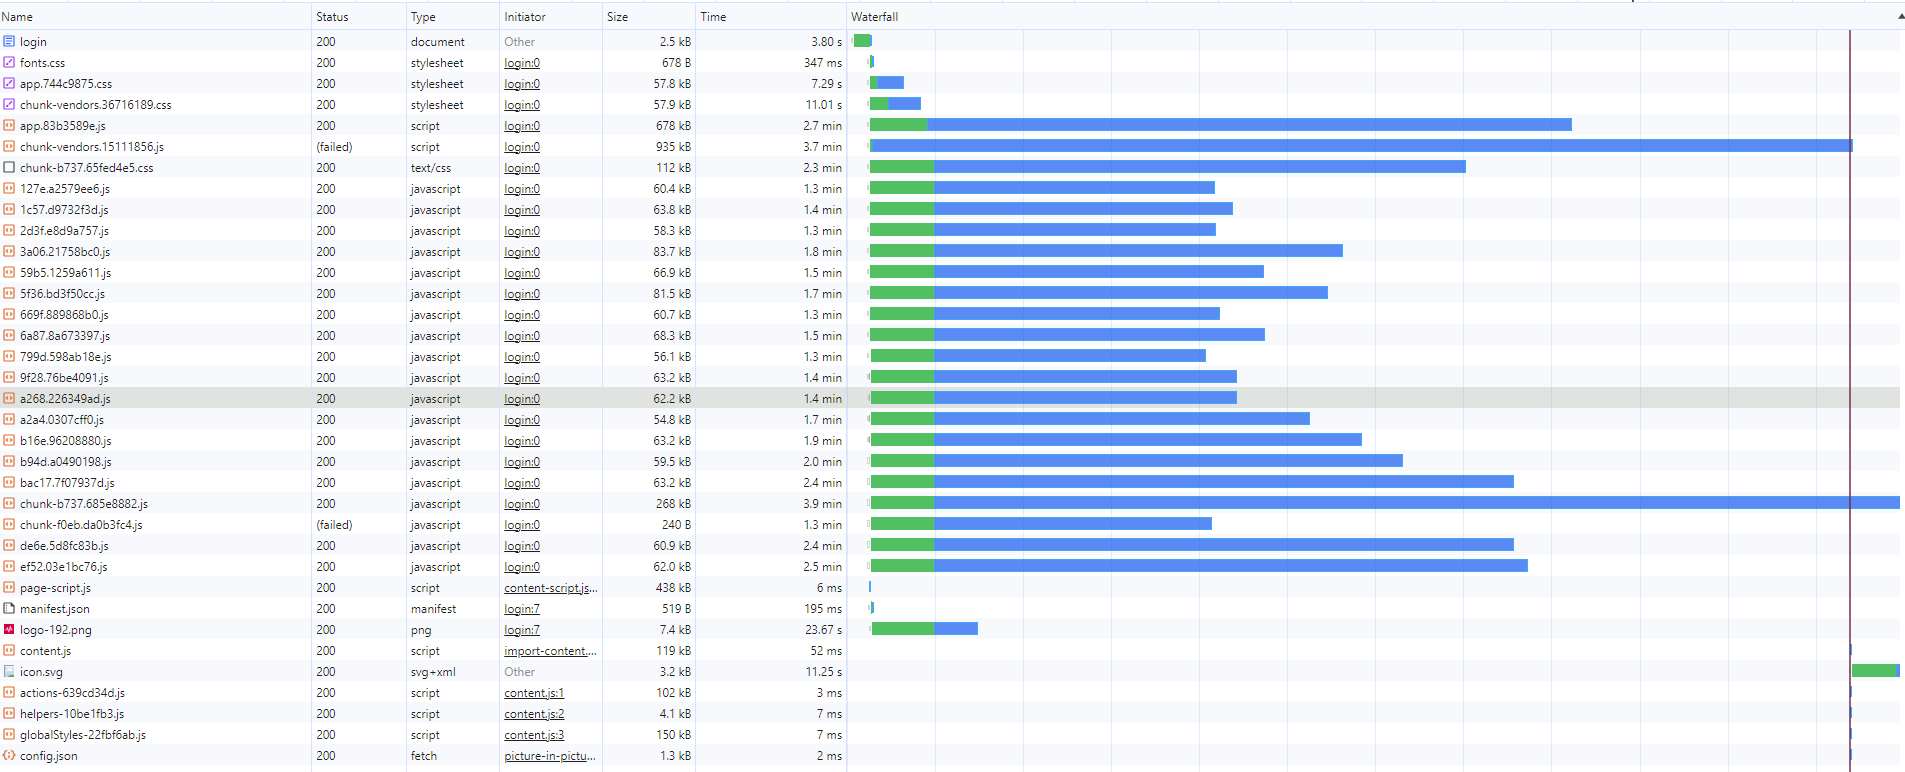
Here is the screenshot from browser dev tool while loading first page after login - it actually failed to load - there are at least two JS files which could not be loaded.
It certainly shouldn’t take minutes. The js files are served up by a very simple container running Nginx. I wouldn’t expect any performance problems with that.
What time of day was this and where are you located? The servers are in Germany.
I posted this literally minutes after taking that screenshot - 2024-01-15 20:46 EST - which would be 2024-01-16 01:46 UTC.
This is from US East Coast, should have no issue reaching out to Europe.
Other cases of similar slowness were around the same time.
After posting this and refreshing the site, it came back with normal performance.
I’d like to add that my issue is strictly with the main site, not forums - no issue opening them while main site is not responsive.
I am thinking of setting up some synthetic monitoring for intervals.icu…
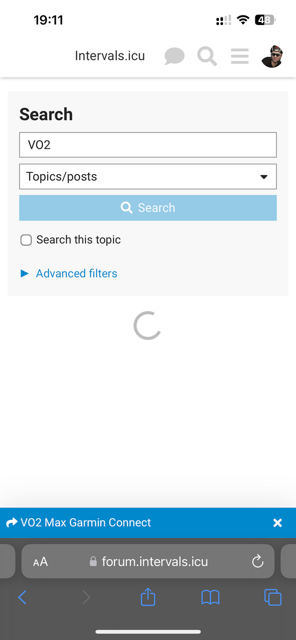
I’m located in Vancouver, BC and having this issue right now as well. If I try to load the login page and leave the tab in the background, sometimes when I come back to it (5-10min later) it’s loaded, and then the rest of the site works fine.
The forum was very slow to load initially as well.
I have set up a synthetic test monitor which will navigate to https://intervals.icu/ and click Login button. Test will run every 5 min from 4 locations around the world (Frankfurt, Boston, Seattle, Tokyo). It will measure time for the flow (I’ll get alerted if it takes longer than 30 sec).
I will report in 2-3 days what the latency is…
The first bit will load all the JS files and so on for the app (Nginx container serving static files). If you login then initial athlete data will be fetched testing the back-end latency (Java app talking to the db).
I do monitor this stuff and use the app myself in peak times (like now) but there is nothing like real user feedback. I am in Cape Town South Africa so quite a bit of time to reach Germany.
No, I decided against simulating login to avoid placing additional load.
Since just clicking Login button is enough to request all resources, this should show us overall latency.
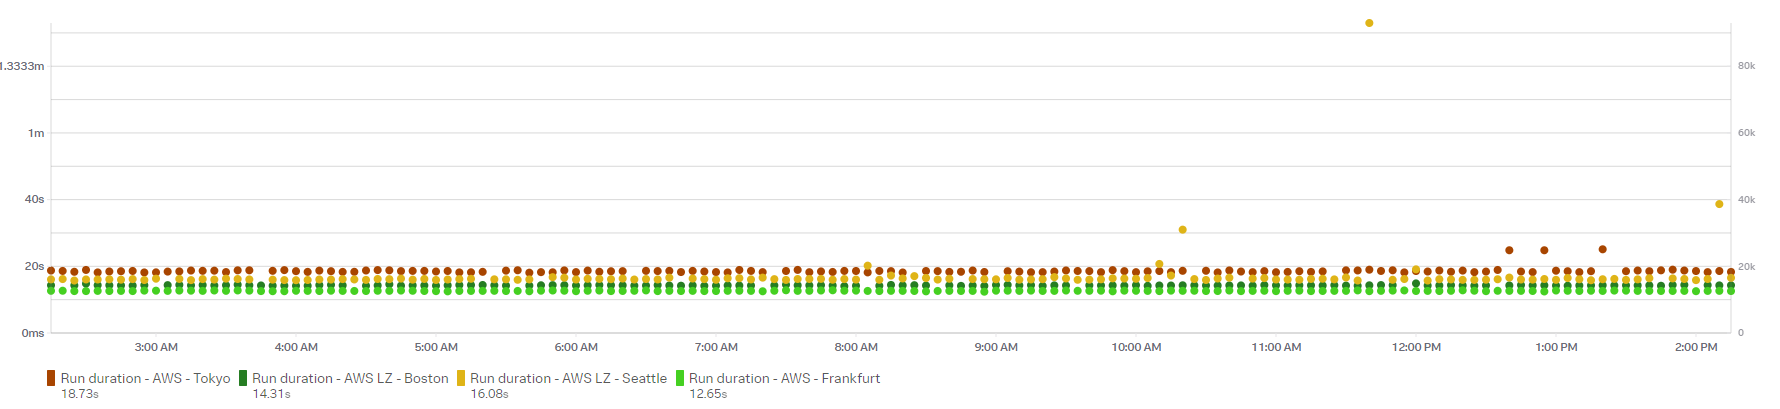
Attached is how this looks for the last 12 hours.
Average is around 15 sec for this simple flow, I think it is a bit too long, however site is JS heavy and most of that should be cached for real users.
Ack 15s. I just loaded in an incognito window and it took less than 2s. I have a fast machine (Apple M3 Max) and 200M connection but the network should be the main thing.
Actually doing a login every 5m from 4 locations won’t create any significant load. So please add that if you can.
Yeah, I am not completely sure where that tool gets 15 sec, will need to check.
But testing using Chrome dev tools with disabled cache still show time closer to 5 sec, I can share .har file if you want.
The thing is that visually page completes faster, it just continues to load some other resources in background.
Unfortunately, there is no easy way for me to share the report from the synthetic monitoring tool I am using… I’ll see if I can try something else.
Still, if we ignore baseline values, this should tell us if there are major slowdowns…
These long times (“run duration”) were the total time synthetic engine took to execute - which included spinning up headless browser, etc.
Instead of that timing we can look at the onload time which is defined as “Time until the page has loaded. This corresponds to the browser load event.” This time us usually under a sec for Europe and up to 2 sec for US - which is good.
There is not much history, however the test from Seattle is currently very slow - takes up to a minute because of all fonts and are loading very slow.
So this looks like an issue with reachability from other parts of the world…
Yes, CDN would be the best option for static content…
Can’t help much myself, but I bet there is plenty of info if you do some research… I’ve heard good things about Cloudflare.
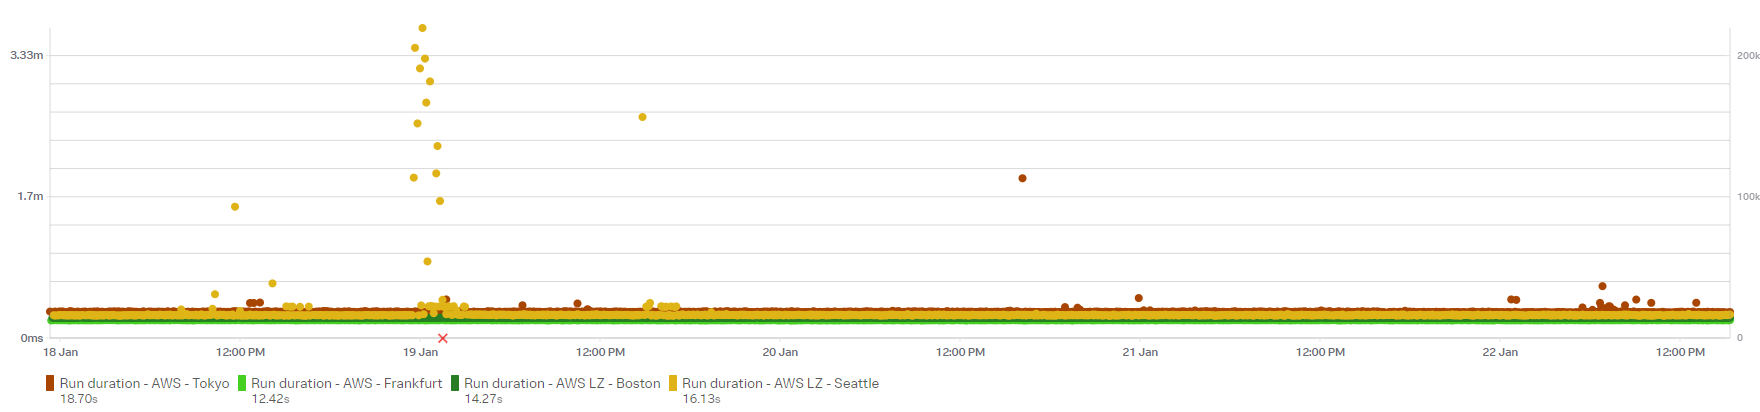
Here is the history so far, still spikes now and then.