No puedo crear el grafico de potencia30s y wbal juntos y el de altitud, si pueden ayudarme lo agradecere mucho.
Here it is:
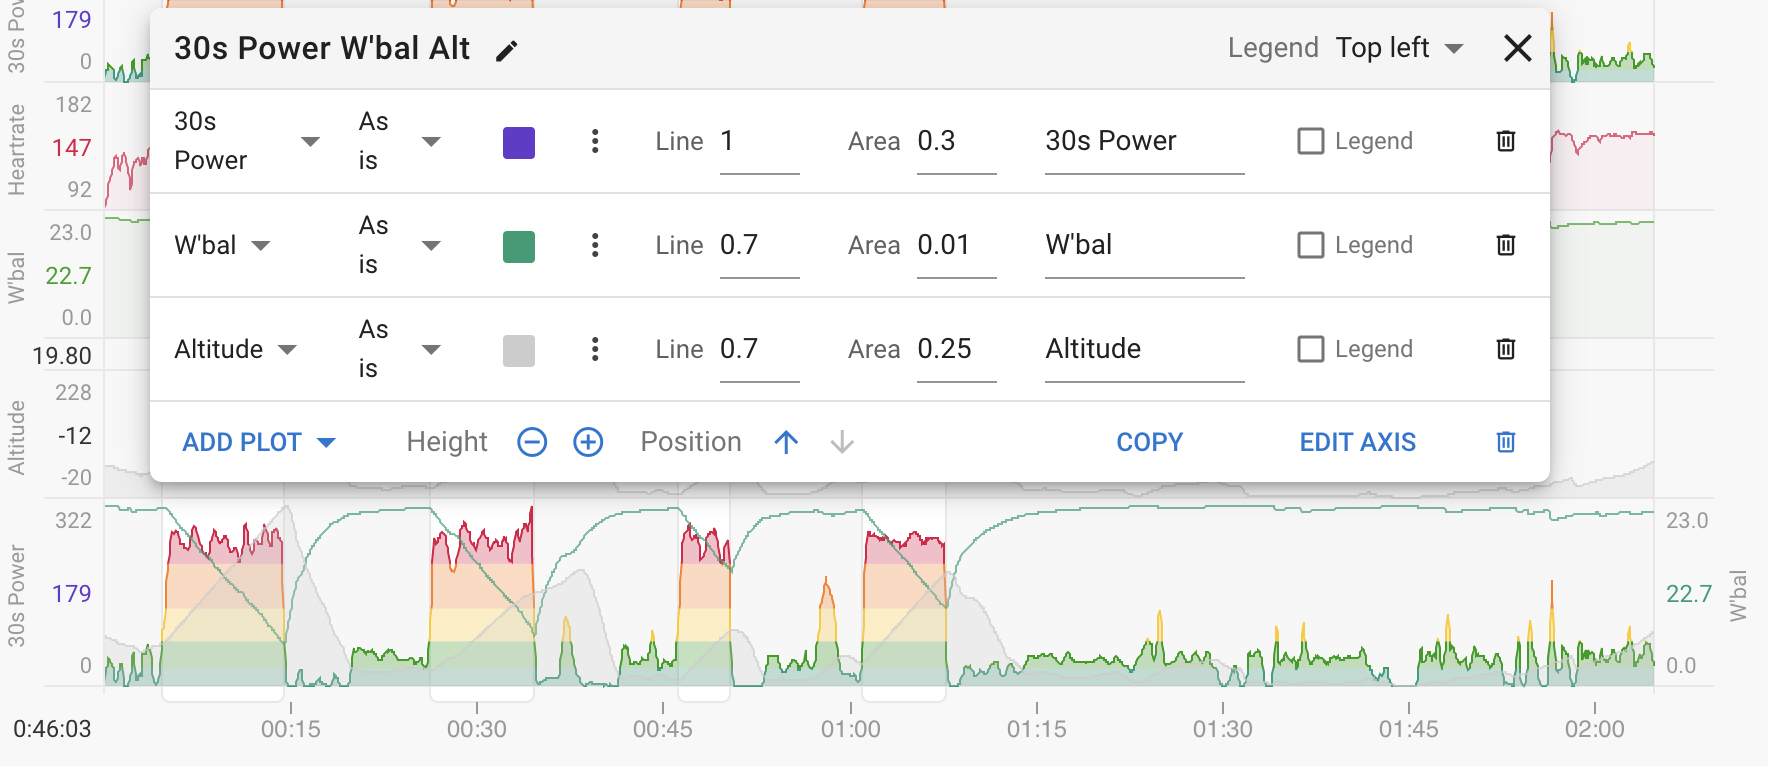
You can copy this and do Charts → Paste:
{
  "id": "ccfce933da",
  "name": "30s Power W'bal Alt",
  "height": 90,
  "yAxisLabel": null,
  "yAxisMin": null,
  "yAxisMax": null,
  "y2AxisLabel": null,
  "y2AxisMin": null,
  "y2AxisMax": null,
  "plots": [
    {
      "stream": "watts_30s",
      "color": "#6633cc",
      "text": "30s Power",
      "areaOpacity": 0.3,
      "lineOpacity": 1,
      "legend": false,
      "transform": "none",
      "id": 1,
      "extras": []
    },
    {
      "stream": "w_bal",
      "color": "#009E73FF",
      "text": "W'bal",
      "areaOpacity": 0.01,
      "lineOpacity": 0.7,
      "legend": false,
      "transform": "none",
      "id": 2,
      "extras": []
    },
    {
      "stream": "altitude",
      "color": "#ccc",
      "text": "Altitude",
      "areaOpacity": 0.25,
      "lineOpacity": 0.7,
      "legend": false,
      "transform": "none",
      "id": 3,
      "extras": []
    }
  ],
  "legendPos": "topLeft"
}
1 Like