Hi, is it possible to have the estimated W’ for each ride? As already done for the estimated ftp for each ride. It would be interesting. Thanks.
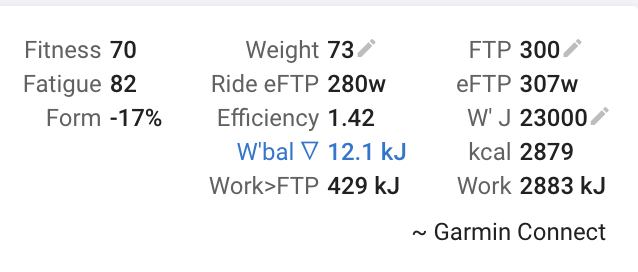
The “Max W’bal depletion” number is very close to that:

OK, thanks very much! Great!!!
I’m not an expert in W’ but is the calculation Work>FTP correct? It seems really high, almost 20 times your W’ capacity.
I had a easy outdoor ride today and results are similar. I can’t imagine having done that much work over FTP  .
.
Thought this over a bit more and it is probably the Total Amount of work for every moment you went above FTP. Then it would make more sense.
Its quite a simple calculation done over the interpolated power stream (1s per tick) without any smoothing or anything. So maybe the spikiness of the power data is inflating it?
I could calculate it using the 5s moving average stream that I use for time in power zones. That would get rid of the spikes. Not sure what other tools do?
Edited my post while you were answering. It’s a different way of interpreting Work>FTP.
I thought only the work over FTP and you probably the total amount of work during those periods over FTP 
Given it even some more thought. This number could be more meaningfull if you substracted the work under FTP because then it gives an idea of how many times you can use partial amounts of W’ during a longer ride. As it is now, it doesn’t give much usefull information.
1 Like
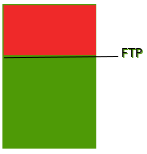
Just realized that I may not be explaining this clearly enough. You (probably) calculate the sum of the green and red boxes in underneath graph while it would be more intresting to calculate only the red box.
1 Like
That would make it harder to compare to the total work done on the ride though. Right now you can compare “Work>FTP” to “Work” and look at the percentage and so on.
True, hadn’t tought about that. But when talking work>ftp, I imediately think W’. So at this moment, I don’t know what I’d prefer. Let’s see if anybody else chimes in.
FTP ≠ CP
As FTP is submaximal, no wonder work>FTP is higher than W’.
Absolutely correct and probably a very good reason to keep it as it is.
Maybe change the description a bit when hoovering over with the mouse . “Total work at intensities above FTP” perhaps? That would avoid the confusion I had.
I think both of these metrics are interesting!
I agree a better explanation for what the current “work > FTP” data field actually is would help, but a new data field showing just the work over threshold as per @MedTechCD’s earlier post would also be nice. While @Coach_Ron is right technically ref FTP ≠ CP, the total work above threshold will be of same order of magnitude whichever you use for this calculation - and of course since currently I believe this is based off the user entered FTP (or CP) and W’ in settings, it is as “right” as the particular user wants it to be.
3 Likes
I just now stumbled over this too. Imho the “work>FTP” is a bit misleading. As for the the percentage, that’s already baked into the time @Zone (Z5+6+7…vs Z1-4), wouldn’t you say?
W’ on the other hand only gives you the lowest value for the entire ride. So a number for “actual work above threshold” is kind of missing.
Imho either “Work>FTP” should represent that amount of work, or perhaps W’ should express accumulated kJ instead of the single lowest amount of W’.
Or, yet another metric like W-Work in Golden Cheetah