What I meant was there is no point having a CP value set to below my FTP as I’d be dipping into my W’ at power value below FTP which contradicts what W’ is.
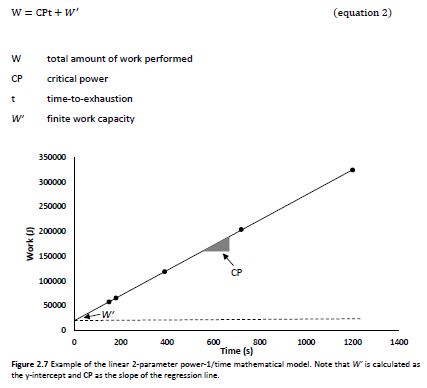
Not sure this is strictly true, since the definitions of CP & W’ are intrinsically linked and interdependent (see image), but the definition of FTP is not at all dependent on W’ or CP. It’s just that FTP happens to be quite similar to CP, but FTP should normally be higher than your CP if all those metrics have been determined from good inputs/efforts.
I would suggest if using W’ for training but with a preference not to have different numbers for CP & FTP it may be better to use your CP value for FTP rather than the other way around.
OK thanks, interesting. Looking at my 42 day chart of efforts it’s clear that I need to improve the quality of the chart by making some more max efforts at various durations, my 42 day curve is way below the modelled curve. It starts to get close at the 10 minute mark and by 15 minutes it’s on the line.
That value is way out currently as I haven’t done a hard 60 min effort for over 6 weeks, it says 208W and I know for a fact I can do 25 mins at around 255W and as I say, my ramp test yesterday gave me 240. I also can’t believe my W’ is just under 50,000. I installed an IQ app recently and during some hard efforts with it set to 14600 I was getting close to zero. More work to do for me to get the data better.
I’m certainly not capable, 801W 1 sec max recently, I’m 54 soon and have never trained for max power so pretty low. In Golden Cheetah I had my W’ at 13700 and my ramp test took me down to 1.0 which seems reasonable. Strangely, and I don’t know how this happened, the W’ in intervals.icu has changed to 32241. Anyway, as I say, I need some better efforts to balance up my power curve.
Ah I see so to the right of the black horizontal line to the right of the date at the top of the line, thanks. Still skewed by a lack of a hard 60 min effort.
I’ve been doing some efforts way above FTP recently and been monitoring W’ one the IQ app and comparing what the ICU power chart shows for the ride. The app had me down at zero today after 5 x 1 min intervals at 125% FTP bit my icu chart gets nowhere near that low.
Hi David, it’s one of the ones mentioned in the other thread recently but not the Skiba one, sorry at work just now so can’t check.
I was doing 3 sets of 5 x 1 min but yes I could have done a 6th interval, it would have been tough but I almost certainly would have completed it as I was hitting and exceeding target power right up to 15th interval.
Good to know, thanks @david. This setting is configurable in the Garmin CIQ app so that now the W‘ Balance shown on the Garmin screen should closely approximate what I’m seeing in intervals.icu.
Great point, this could be the resolution to my query too. I also just realised I was on smart recording, I had to reset my device a while back and never changed it back to 1 sec.
If you have the default power model selected (FFT curves + Mortons 3P) then the W’ number is based on the curve for your eFTP i.e. it is the same for everyone with the same eFTP. I am going to be doing some work on automatically estimating W’ from short efforts soon to go with eFTP.
If you have one of the other power models selected then W’ is the value derived from the model. You need to have the right inputs for this to work well.
This is not true any more. W’ is individually estimated by looking at the most energy above eFTP on the athletes actual power curve for the selected duration.
 I’m certainly not capable, 801W 1 sec max recently, I’m 54 soon and have never trained for max power so pretty low. In Golden Cheetah I had my W’ at 13700 and my ramp test took me down to 1.0 which seems reasonable. Strangely, and I don’t know how this happened, the W’ in intervals.icu has changed to 32241. Anyway, as I say, I need some better efforts to balance up my power curve.