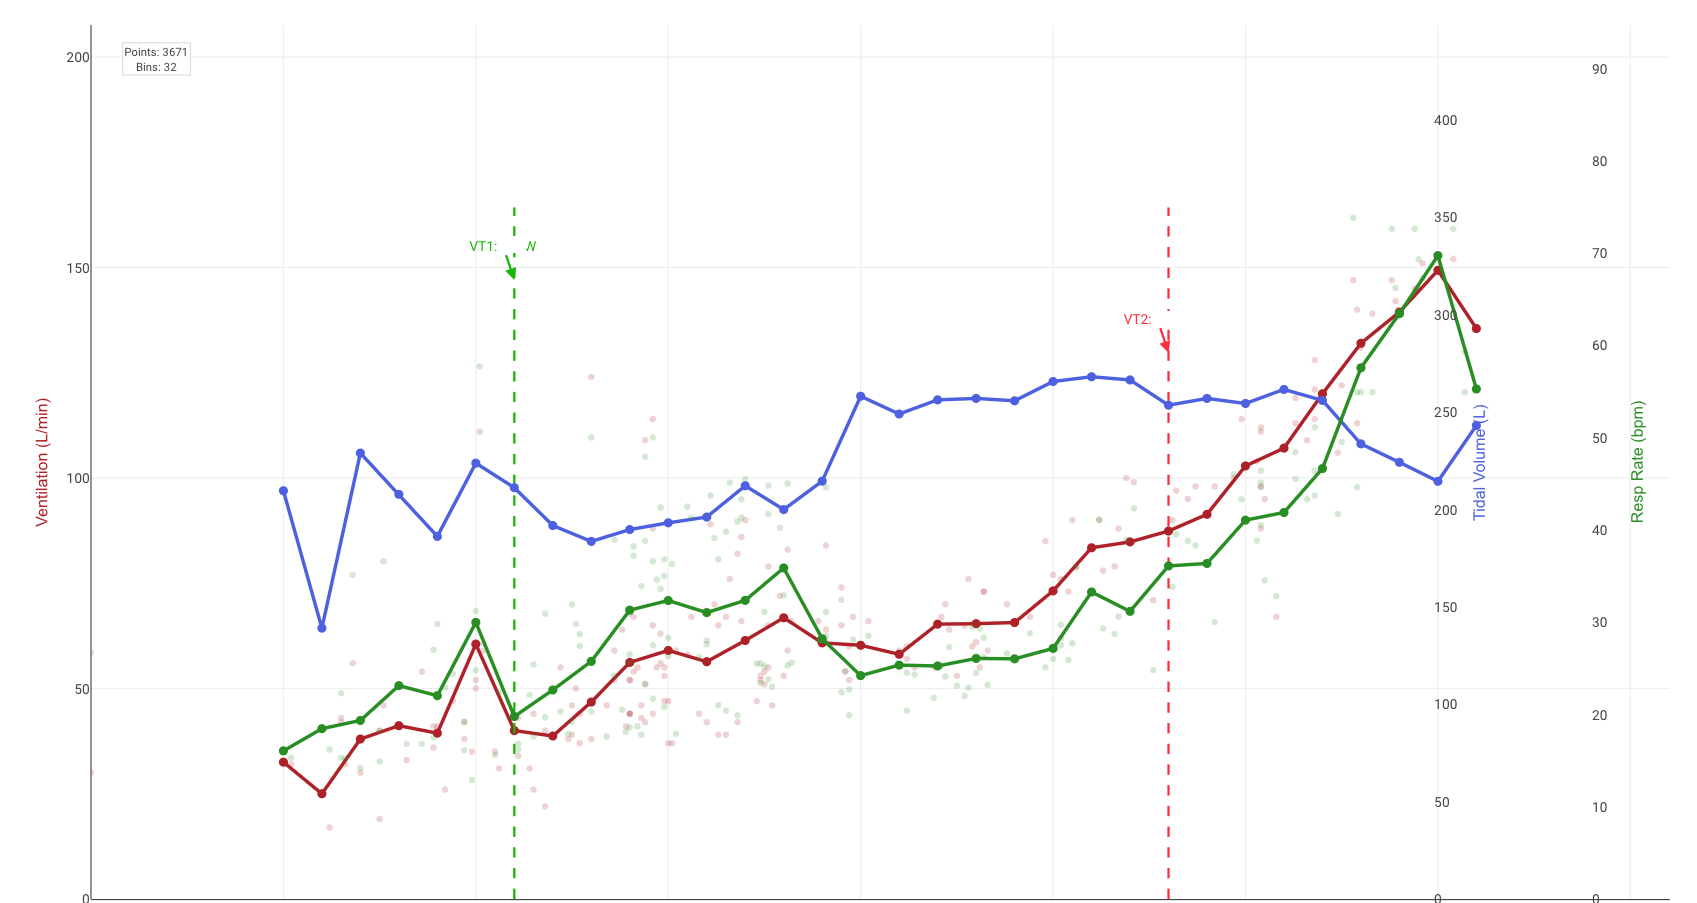
Created alpha version Ventilatory Threshold Analysis Activity Chart (Tymeware), pls comment
Thanks for the initiative.
It’s a cool start!  So far, I’ve to look at your script too briefly. VT1 is clearly wrong, way too low in power
 VT2 is not so bad… (also too low I hope. but not far off).
Would it be possible to show the part-wise linear trends fitted to the VE curve?
I’lll have to look at the code a bit, I guess, to give some decent feedback…
Can you DM share Test fit file?
Why I get error “Insufficient stages”?
9 stages, each 3min.