You can now add a VAM chart to the ride timeline:
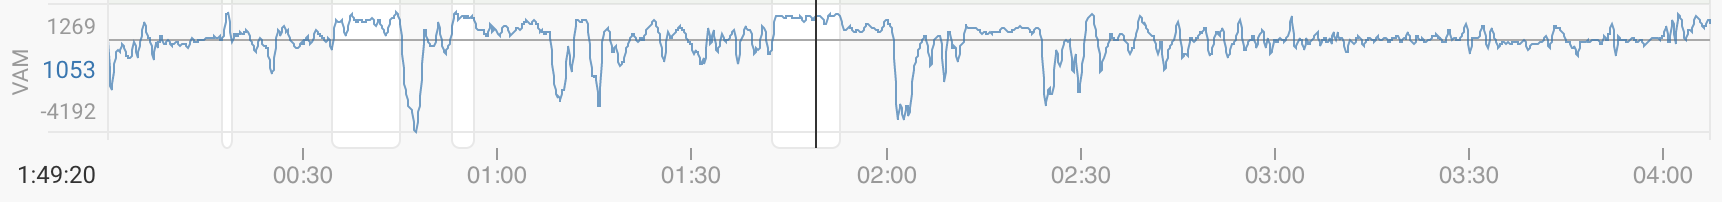
This is a 30 second centred moving average of VAM. It is a bit noisy without the averaging.
You can now add a VAM chart to the ride timeline:
This is a 30 second centred moving average of VAM. It is a bit noisy without the averaging.
With some missing data (in my activity i1598368 there are is no altitude data for the first few seconds) the chart is something like that
I just fixed that. Tx.
Hi @david - this is probably a very niche feature request, but is it possible to get the VAM present as relative power on the ride timeline by taking the gradient into account?
Thank you
How is that calculated? Also the gradient data is often a bit messy so that might be an issue.
Ah, yeah that might be an issue.
Its basically VAM/(200+10*gradient) when VAM is in m/h and gradient is a percentage.
