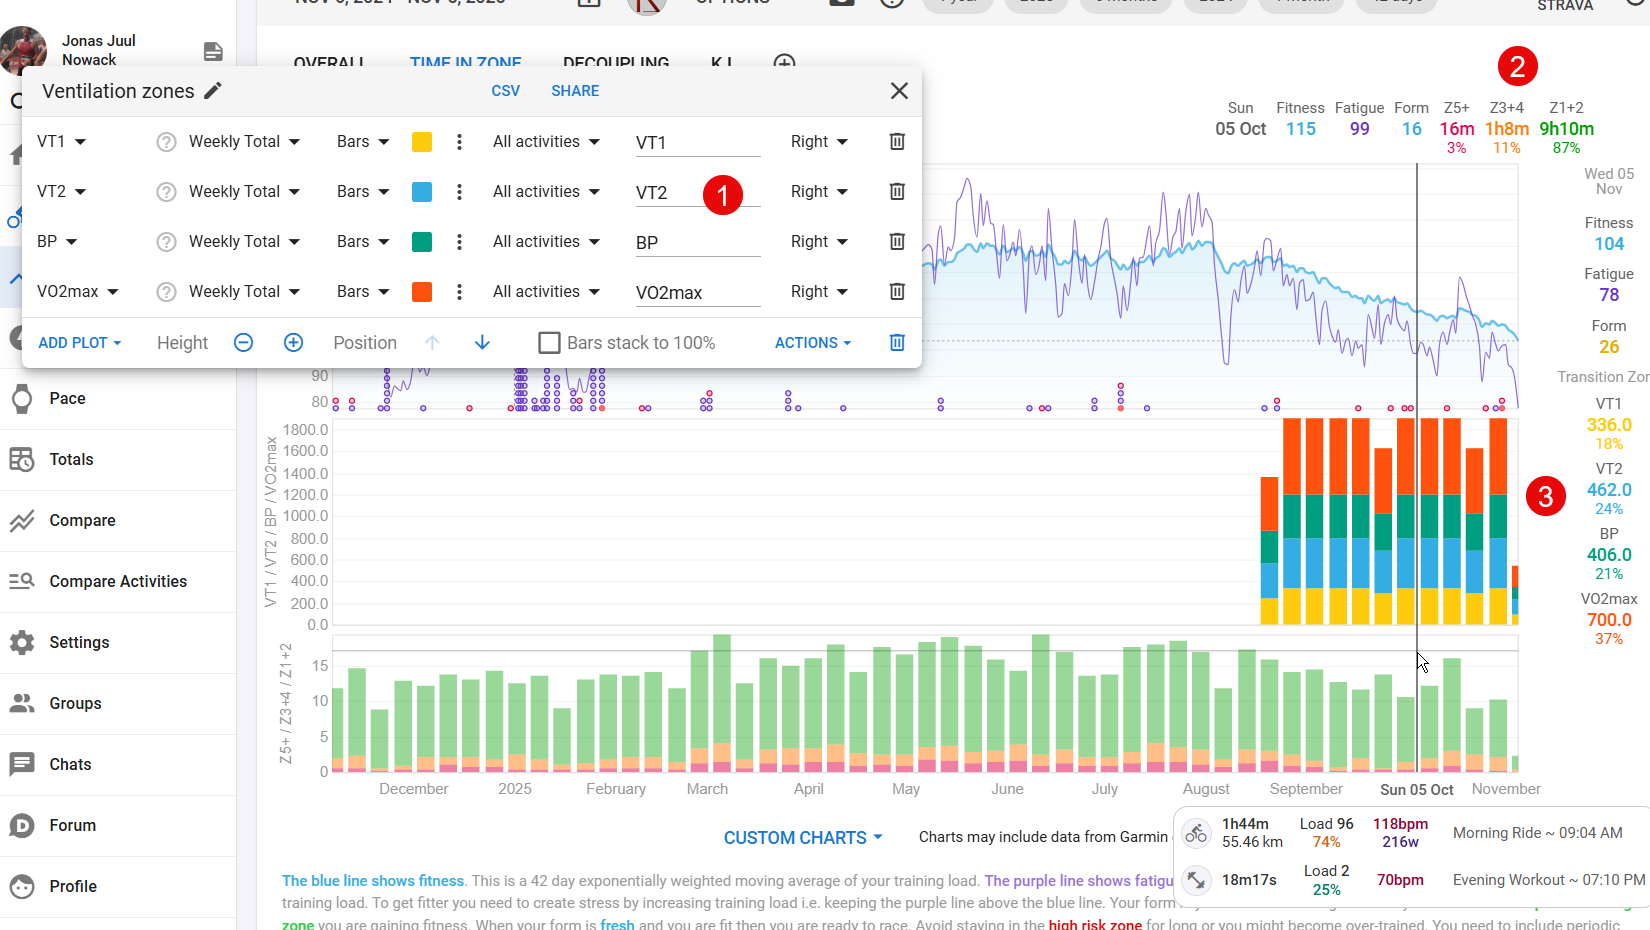
I’ve tried to create time in zones based on my Tymewear data (1).
I’d like to see my distribution across the zones both as percentages and in hours/minutes (2), but I can’t seem to get it to work properly (3).
Can anyone help?
Regards
Jonas
I’ve tried to create time in zones based on my Tymewear data (1).
I’d like to see my distribution across the zones both as percentages and in hours/minutes (2), but I can’t seem to get it to work properly (3).
Can anyone help?
Regards
Jonas
i’ve just received my tymewear vitalpro and tried creating the same chart. the issue is that the chart is totaling actual values from each activity, not the “time in zone” for each plot.
according to this post from @david it’s not yet supported natively…but could be achieved with custom zones and javascript; beyond my current skillset ![]() but definitely a chart i’d like to use.
but definitely a chart i’d like to use.
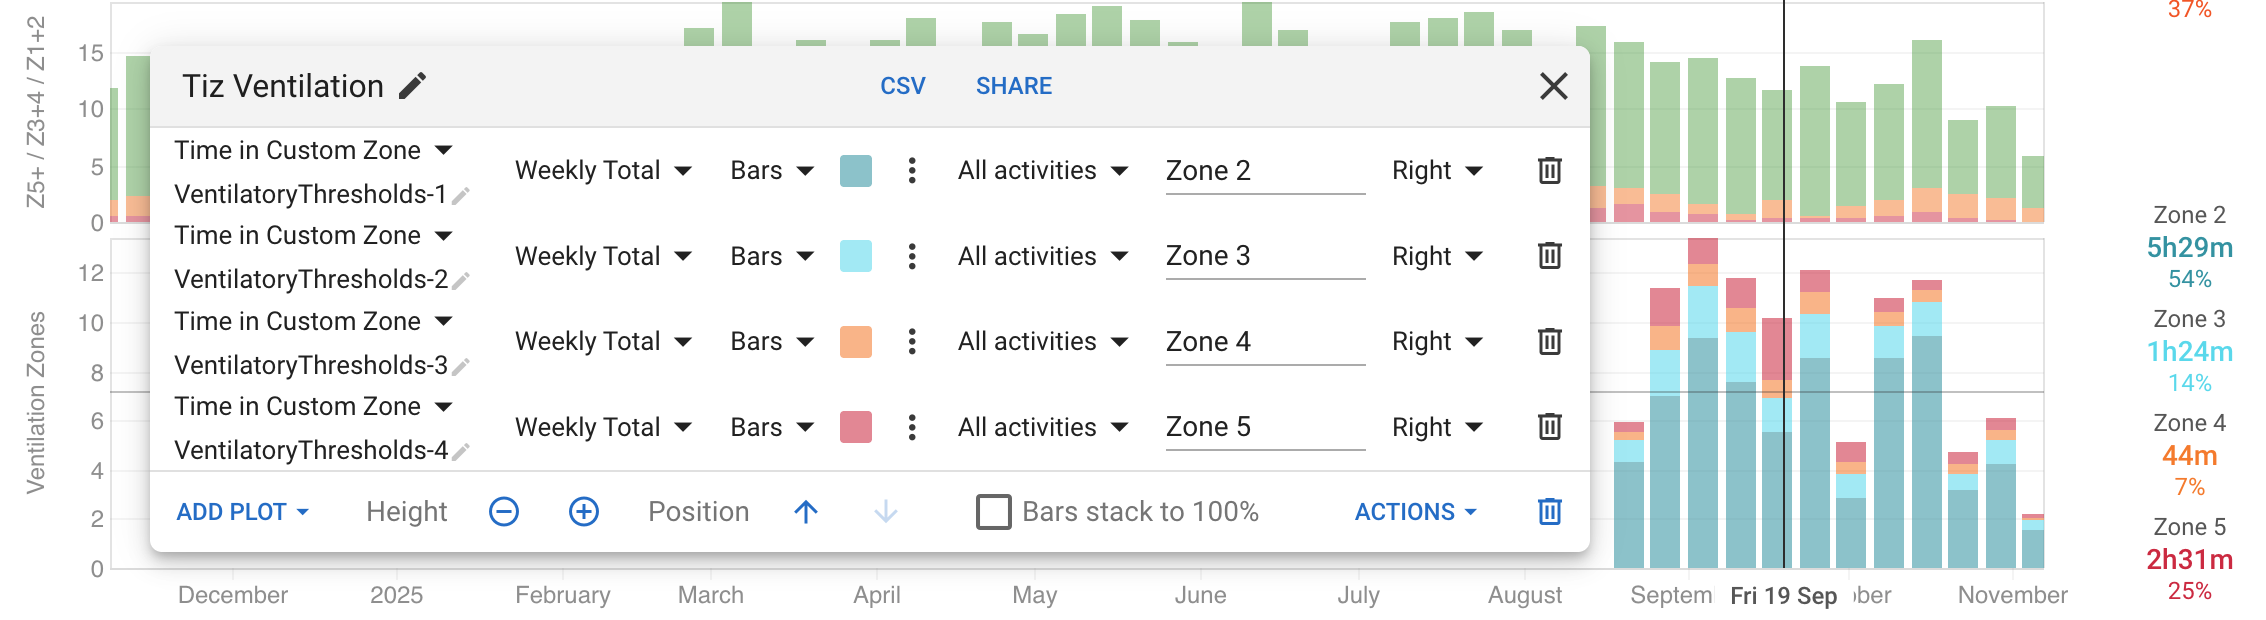
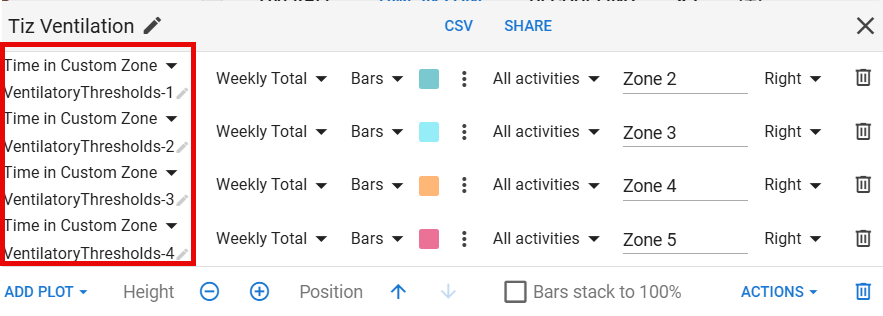
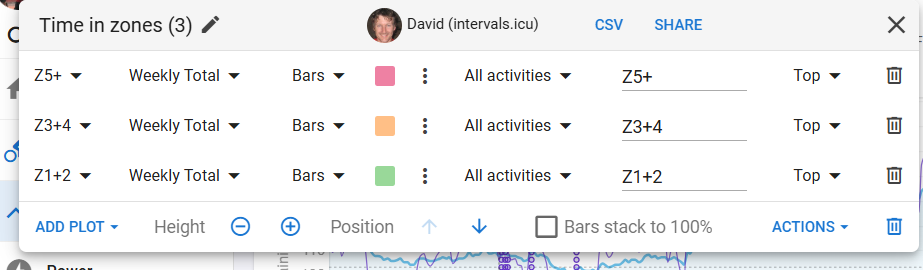
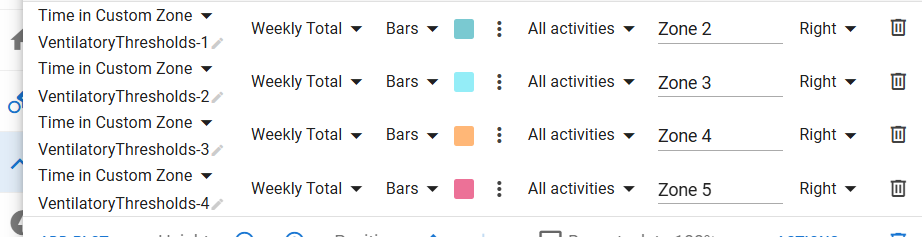
You need to add “Time in Custom Zone” plots. I added a “Tiz Ventilation” chart to your “Time In Zone” tab:
Thank you very much David ![]()
@Jonas_Juul_Nowack @david
How can I replicate these Charts - I am a Tymewear User as well and am looking for visualization of my tyme-Data!
HI
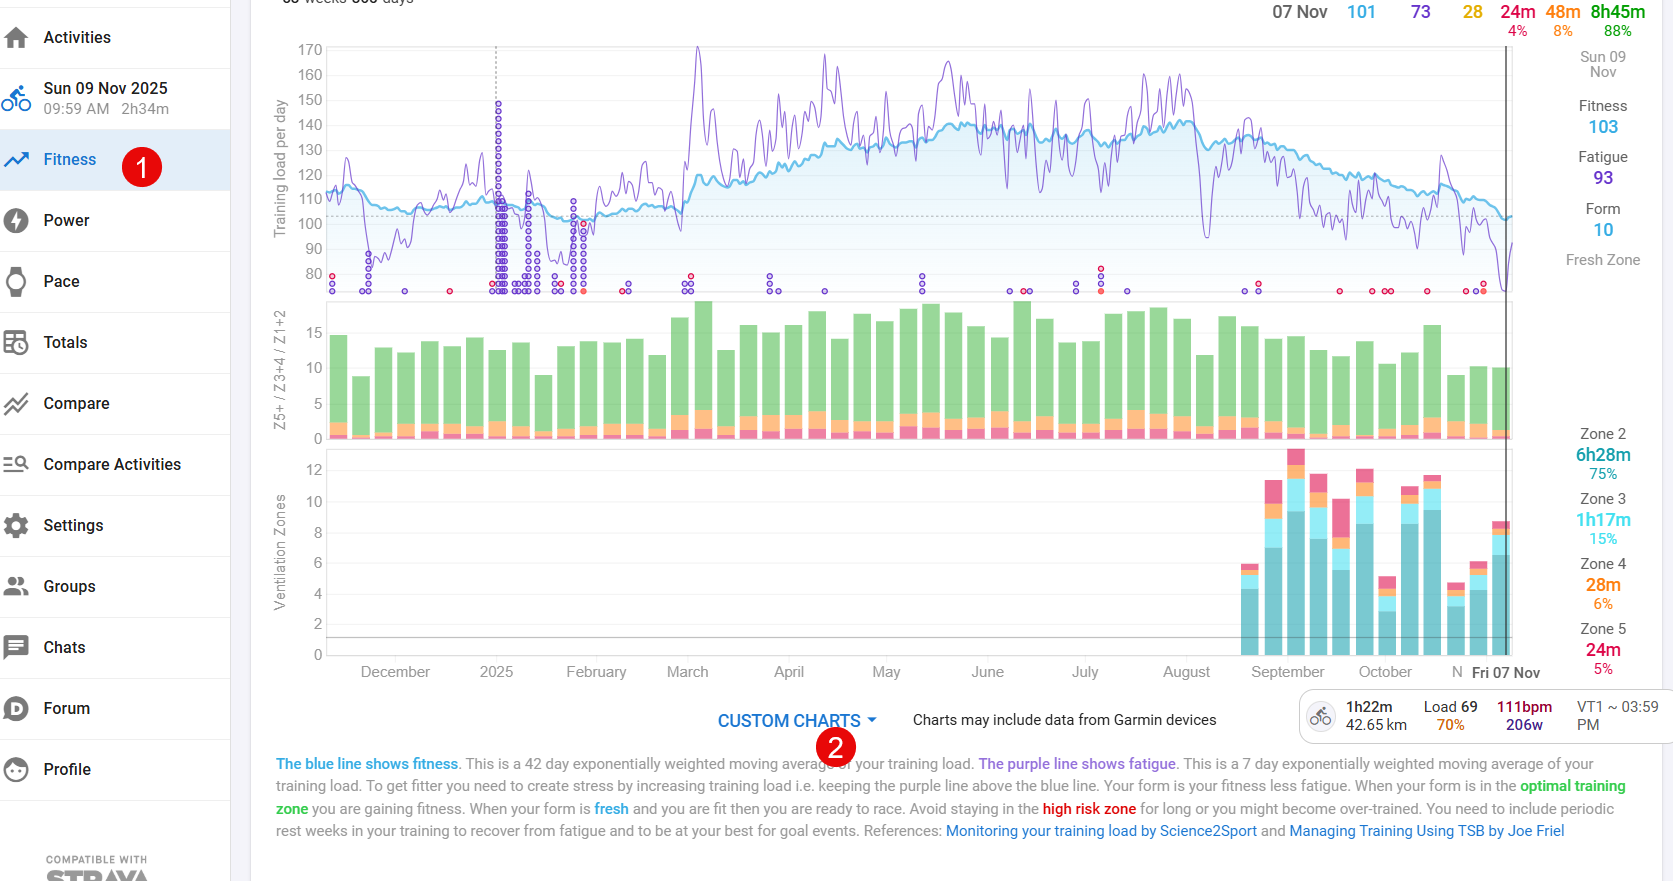
First go til the Fitness (1) and then choose Custom Charts (2)
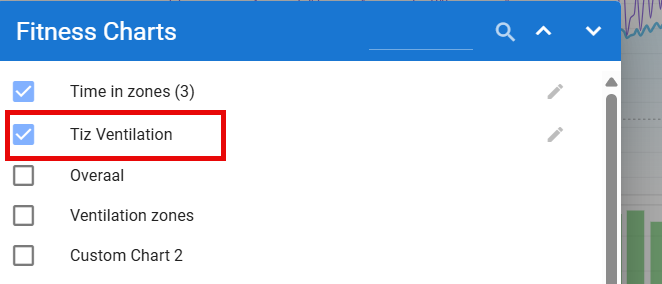
Find the Tiz Ventilation
Choose this if you want time in the zone on weekly basis
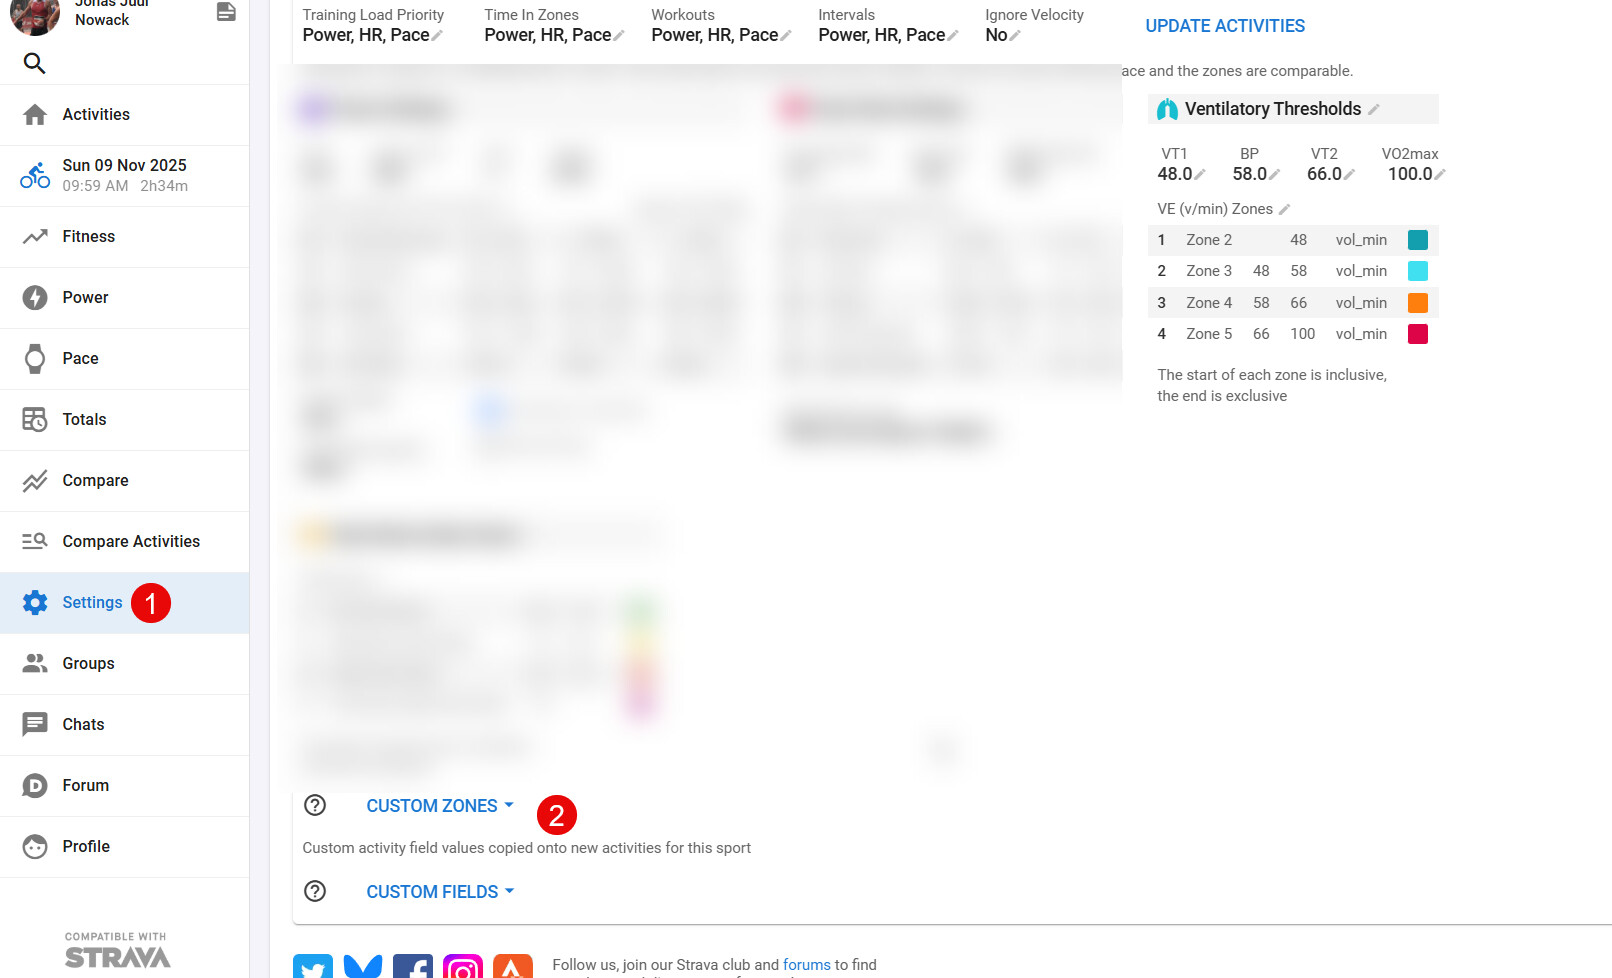
Go to Settings (1)
Then choose Custom Zones (2)
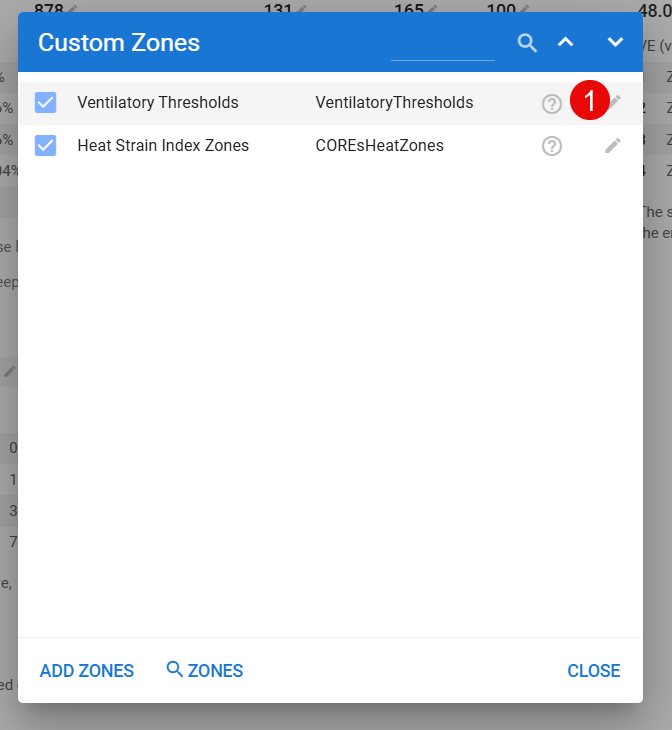
Then search for the Zones (1)
You need to search for (2) Ventilatory …
Then click on the “pencil” (1)
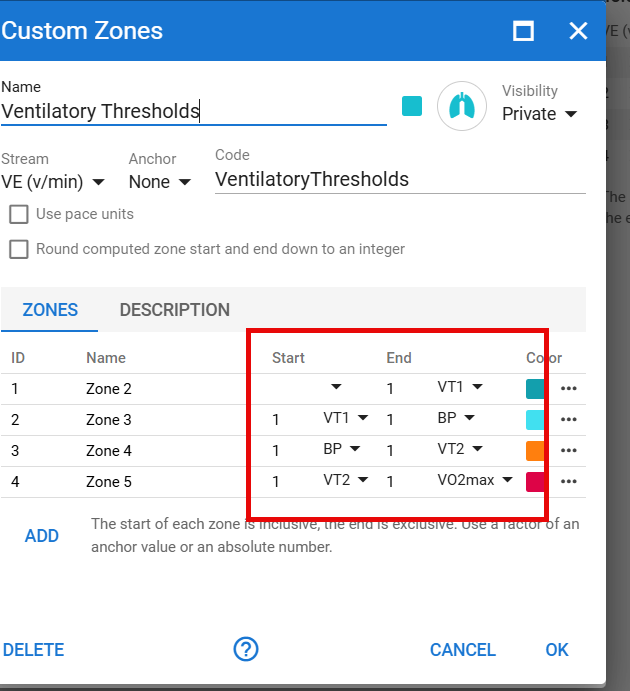
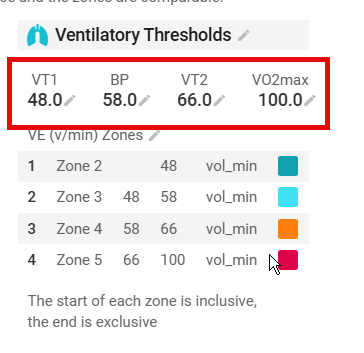
Then secure that numbers is like
Then set your zones from the Tymewear app.
Hope it works ![]()
@Jonas_Juul_Nowack Thanks for the manual - but unfortunately, I do not have Tiz Ventilation.
I search for it, get a couple of TIZ graphs, but Tiz Ventilation is not amongst them…
Oh - if then take the chart Time in zone.
Then you have to change them to
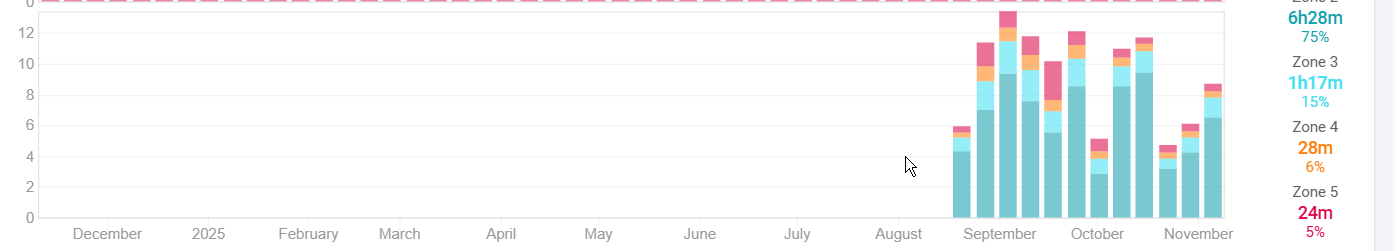
It gives this (not the best, but is a start)
Either I am too stupid or something is different at my intervals. I cannot reproduce your Manual - even not with the normal Time in Zone Chart.
How “far” do you get or where to you “end” ? ![]()
@Jonas_Juul_Nowack , thank you for the tutorial!
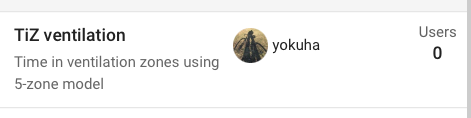
I’ve now created and shared a TiZ ventilation “custom chart”, should be shared publicly:
However, the problem I have is that it does not display any data, despite me having uploaded a few activities including tymewear data – tymewear-dashboard exported and then manually uploaded to i.icu… This seems to be related to me ignoring parts of the file – when I do not ignore these parts it does in fact display the ventilation TiZ…
![]()
I do ignore these parts as these files are effectively duplicates of the regular Wahoo/etc. uploaded activity – which are without the ventilation data but with other relevant data that tymewear kills in their dashboard export (such as L/R balance and other powermeter values that are important to me).
Looking forward to recording of complete data in a single device or merging in intervals.icu;-)
I have the same problem (TiZ is not displayed in the “Ventilation TiZ” diagram). But I don’t understand why the data are displayed in the standard TiZ diagram and not in a different coordinate system (Ventilatory Thresholds)