I recently managed to buy a Tymewear VitalPro strap, mostly with the purpose of learning about the data you can get from the device. As a coach I find it important to be early with these new developments. Additionally, it’s super interesting to learn these new things.
I gave the strap to a rider I coach and I’ve collected about 2 weeks of data so far. While that has already given us some insights, there are some limitations in analyzing the data at this moment.
Some of the most interesting data out of the Tymewear device seems like it needs to processed first before it can be properly analyzed. I personally would be interested in seeing some kind of chart aimed at analyzing the mobilization index mentioned on the Tymewear website (How to use breathing in training – Tyme Wear™) that would look similar to the pover vs heart rate decoupling charts that are already available, and tools to track breathing data against power over the long term. Except I am not good at programming in any way.
So my three questions are:
Are there any plans within the Intervals team of adding these kinds of metrics?
If it is left up to the users to design these things, is there anyone out there who would be interested in helping me (a completely hopeless programmer) to set them up?
Is there anyone out there who’s interested in sharing/discussing their findings concerning breathing data? I’m scrambling for useful information across the internet but there doesn’t seem to be much out there.
I know I’m not the only one here using Tymewear’s products, it would benefit more people than just me to come up with more ways to visualize this data better.
P.S. as it covers multiple directions I’m not sure this post belongs in the feature requests category. Please tell me if I did it wrong.
Hello, I recently got a Vital Pro from Tymewear. Something that really interested me beforehand was the mobilization index. This should be visible in real-time as a kind of decoupling factor.
This is important when you reach, for example, your zone 2 or other zones in terms of fatigue resistance. It’s strange that this was discussed here at Tymewear, and that it’s available in the Tymewear dashboard. A developed field for the Garmin would also be welcome. I don’t have the technical expertise for this, but perhaps someone is interested. I’ll contact Tymewear about this. I believe this was developed in collaboration with Stephen Seiler. Displaying the heart rate reserve compared to the respiratory reserve shouldn’t be that much of a problem.
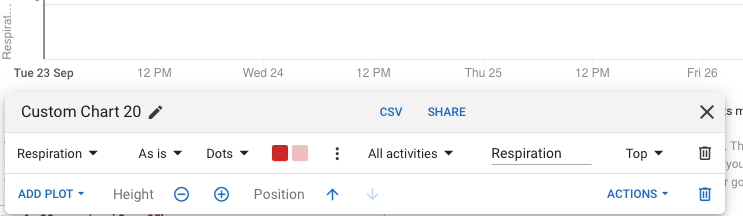
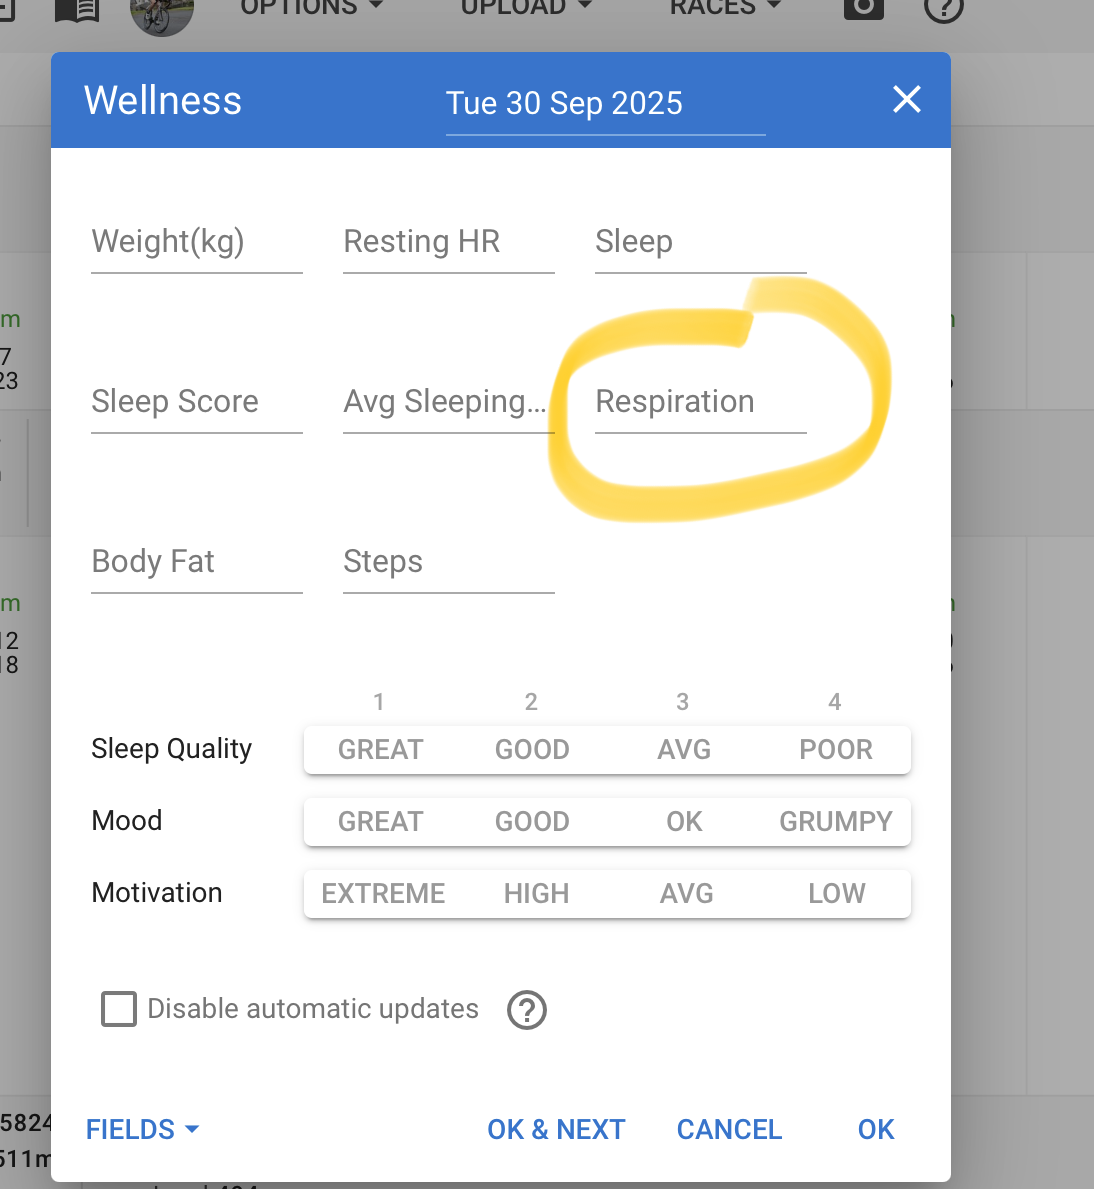
along these lines, it doesn’t seem like the Tymewear info is available for Fitness charts? There is a “Ventilation” chart but I’m not seeing any data.
The provided Tymewear tools are…not that great? Trying to look at volume across time (ha!) is there, but you can see the most recent week and the most recent month. At least that I figured.
In general, how are the other Tymewear users here feeling about this so far? That might be a post for the Training forum, I suppose.
This is not going to be pulling the Tymewear minute ventilation (VE), which is the one I really need to plot. Thanks for looking into it, I also wasn’t very clear what precisely I was looking for.