TRMNL intervals.icu Plugin

Hey, I just wanted to share that yesterday I built a plugin for the e-ink display called TRMNL. This was only possible because of the amazing API that intervals.icu provides.

For now I’ll keep testing the plugin for my own use cases and once I can confirm that everything works as expected, I will most likely make it public, so others can use it too. I added the logo on the bottom left for brand awareness, I hope this is okay. The design and setup is heavily inspired by the intervals.icu chart view.

12 Likes

Thats so cool! Thanks a stack and please keep the logo :slight_smile:

Very cool, now I want one.

1 Like

Ordered :rofl: thanks for the hint. I can think of so many things…

I have also created a plugin, which shows your key fitness values and your next workout.

I still need to make some changes to support different step formats (like ramps, freerides, running etc)

2 Likes

Can you share this plugin please?

If you mean my one, it’s not easy to share, as it requires multiple APIs which I process elsewhere to generate a combined response and then digest in TRMNL. I could share the code and logic and if helps?

That would be fantastic! Much appreciated.

Here’s the markup, so you just need to work out how to bring in the data via the intervals.icu APIs.

<!-- import Highcharts + Chartkick libraries -->
<script src="https://code.highcharts.com/highcharts.js"></script>
<script src="https://cdn.jsdelivr.net/npm/chartkick@5.0.1/dist/chartkick.min.js"></script>
<script src="https://code.highcharts.com/modules/pattern-fill.js"></script>

<!-- markup with empty, ID'd element for chart injection -->
{% assign atl = wellness:atl%}
{% assign ctl = wellness:ctl%}
{% assign workout_date = events:start_date_local | date: "%d/%m" %}
<div class="view view--full">
  <div class="layout layout--col gap--space-between">
    <div class="grid grid--cols-3">
      <div class="item">
        <div class="meta"></div>
        <div class="content">
          <span class="value value--tnums">{{ctl | round}}</span>
          <span class="label">Fitness</span>
        </div>
      </div>
      <div class="item">
        <div class="meta"></div>
        <div class="content">
          <span class="value value--tnums">{{{atl | round}}</span>
          <span class="label">Fatigue</span>
        </div>
      </div>
      <div class="item">
        <div class="meta"></div>
        <div class="content">
          <span class="value value--tnums">{{ ctl | minus: atl | times: 100 | divided_by: ctl | round }}%</span>
          <span class="label">Form</span>
        </div>
      </div>
    </div>

    <div id="chart" style="width:680px;"></div>
  </div>

  <div class="title_bar">
    <img class="image" src="https://intervals.icu/logo-120.png" />
    <span class="title">intervals.icu</span>
    <span class="instance">Next workout: {{events:name}} {{workout_date}}</span>
  </div>
</div>

<script type="text/javascript">
  var createChart = function() {
    // Extract the steps array from the workout_doc object
    var steps = {{ events.workout_doc.steps | json }}; // Assuming you're using a templating engine like Liquid

    var currentTime = 0;
    var seriesData = [];

    // Define power ranges and corresponding pattern URLs
    var powerRanges = [
        { min: 0, max: 60, pattern: "https://usetrmnl.com/images/grayscale/gray-6.png" },
        { min: 61, max: 80, pattern: "https://usetrmnl.com/images/grayscale/gray-5.png" },
        { min: 81, max: 90, pattern: "https://usetrmnl.com/images/grayscale/gray-4.png" },
        { min: 91, max: 105, pattern: "https://usetrmnl.com/images/grayscale/gray-3.png" },
        { min: 106, max: 120, pattern: "https://usetrmnl.com/images/grayscale/gray-2.png" },
        { min: 121, max: 150, pattern: "https://usetrmnl.com/images/grayscale/gray-1.png" },
        { min: 151, max: Infinity, pattern: "https://usetrmnl.com/images/grayscale/black.png" }
    ];

    // Function to determine the pattern URL based on power value
    function getPatternUrl(powerValue) {
        return powerRanges.find(range => powerValue >= range.min && powerValue <= range.max).pattern;
    }

    // Function to recursively process steps, including ramps, repeats, and freeride
    function processSteps(steps) {
        steps.forEach((step) => {
            if (step.freeride) {
                // Handle freeride steps (assume power is 1)
                var nextTime = currentTime + step.duration;
                var currentTimeMin = currentTime / 60;
                var nextTimeMin = nextTime / 60;

                seriesData.push({
                    data: [
                        [currentTimeMin, 1], // Power is 1 for freeride
                        [nextTimeMin, 1]
                    ],
                    color: "#000000",
                    fillColor: {
                        pattern: {
                            image: getPatternUrl(1), // Use pattern for power = 1
                            width: 16,
                            height: 16,
                            aspectRatio: 1
                        }
                    },
                    fillOpacity: 1,
                    lineWidth: 2,
                    lineColor: "#000000"
                });

                currentTime = nextTime; // Move to the next step
            } else if (step.ramp) {
                // Handle ramp steps
                var startPower = step.power.start;
                var endPower = step.power.end;
                var duration = step.duration;
                var segments = 10; // Number of segments to break the ramp into

                for (var i = 0; i < segments; i++) {
                    var segmentStartTime = currentTime + (i * duration / segments);
                    var segmentEndTime = currentTime + ((i + 1) * duration / segments);
                    var segmentPower = startPower + (endPower - startPower) * (i / segments);

                    seriesData.push({
                        data: [
                            [segmentStartTime / 60, segmentPower],
                            [segmentEndTime / 60, segmentPower]
                        ],
                        color: "#000000",
                        fillColor: {
                            pattern: {
                                image: getPatternUrl(segmentPower),
                                width: 16,
                                height: 16,
                                aspectRatio: 1
                            }
                        },
                        fillOpacity: 1,
                        lineWidth: 2,
                        lineColor: "#000000"
                    });
                }

                currentTime += duration; // Move to the next step
            } else if (step.reps) {
                // Handle repeat steps
                for (var r = 0; r < step.reps; r++) {
                    processSteps(step.steps); // Recursively process nested steps
                }
            } else {
                // Handle regular steps
                var nextTime = currentTime + step.duration;
                var currentTimeMin = currentTime / 60;
                var nextTimeMin = nextTime / 60;

                seriesData.push({
                    data: [
                        [currentTimeMin, step.power.value],
                        [nextTimeMin, step.power.value]
                    ],
                    color: "#000000",
                    fillColor: {
                        pattern: {
                            image: getPatternUrl(step.power.value),
                            width: 16,
                            height: 16,
                            aspectRatio: 1
                        }
                    },
                    fillOpacity: 1,
                    lineWidth: 2,
                    lineColor: "#000000"
                });

                currentTime = nextTime; // Move to the next step
            }
        });
    }

    // Function to calculate max power, including nested steps
    function calculateMaxPower(steps) {
        return Math.max(...steps.flatMap(step => {
            if (step.freeride) {
                return [1]; // Freeride steps have power = 1
            } else if (step.ramp) {
                return [step.power.start, step.power.end]; // Ramp steps have start and end power
            } else if (step.reps) {
                return calculateMaxPower(step.steps); // Recursively calculate max power for nested steps
            } else {
                return [step.power.value]; // Regular steps have a single power value
            }
        }));
    }

    // Process all steps
    processSteps(steps);

    // Find max power value & set buffer
    var maxPower = calculateMaxPower(steps);
    var yAxisMax = Math.ceil(maxPower * 1.1 / 10) * 10; // Round to nearest 10

    // Render Chart
    new Chartkick["AreaChart"]("chart", seriesData, {
      adapter: "highcharts", // Use Highcharts as the adapter
      colors: ["#000000"], // Use a solid color for the line (we're focusing on the pattern for fill)
      library: {
            chart: { 
                type: 'area',
              animation: false,
                height: 260,
                spacingLeft: 0,  
                spacingRight: 0 
            },
            title: { text: null }, // Remove chart title
            xAxis: {
                labels: { enabled: true }, // Keep x-axis labels
                title: null, // Remove x-axis title
                tickWidth: 1, 
                lineColor: "#333333", // Keep x-axis line visible
                gridLineWidth: 0, // Remove vertical gridlines
            },
            yAxis: {
                labels: { enabled: true }, // Keep y-axis labels
                title: null, // Remove y-axis title
                min: 0,
                max: yAxisMax,
                tickInterval: 10,
                lineColor: "#333333", // Keep y-axis line visible
                gridLineWidth: 1, // Light grid lines
                gridLineColor: "#D3D3D3", // Light grey grid lines
                gridLineDashStyle: 'Dot' // Dot-style grid lines
            },
            plotOptions: {
                area: {
                  animation: false,
                    step: 'left', // Creates the stepped plateau effect
                    fillOpacity: 1, // Ensure solid fill
                    lineWidth: 2, // Add a border around each step
                    lineColor: "#000000", // Set the border color to black
                    marker: { enabled: false } // Hide markers for a clean look
                }
            },
            legend: { enabled: false }, // Remove legend (no labels needed)
            series: seriesData
        }
    });
};

  // Ensure chart loads before plugin render
  if ("Chartkick" in window) {
    createChart();
  } else {
    window.addEventListener("chartkick:load", createChart, true);
  }
</script>

Hey @runcaby - I really like what you did! Do you have plans to make your plugin available through the TRMNL plugin page? Or, if not, could you give some advice on how to replicate this?

Hi :slight_smile: I’ve just seen your message. Here is the code:

<!-- import Highcharts + Chartkick libraries -->
<script src="https://code.highcharts.com/highcharts.js"></script>
<script src="https://cdn.jsdelivr.net/npm/chartkick@5.0.1/dist/chartkick.min.js"></script>
<script src="https://code.highcharts.com/modules/pattern-fill.js"></script>


<div class="view">
  <div class="layout layout--col">
    <div id="chart-combined" style="width: 100%"></div>
  </div>

  <div class="title_bar">
    <img class="image" src="data:image/jpeg;base64,/9j/4AAQSkZJRgABAQAAAQABAAD/2wCEAAkGBwgHBgkIBwgKCgkLDRYPDQwMDRsUFRAWIB0iIiAdHx8kKDQsJCYxJx8fLT0tMTU3Ojo6Iys/RD84QzQ5OjcBCgoKDQwNGg8PGjclHyU3Nzc3Nzc3Nzc3Nzc3Nzc3Nzc3Nzc3Nzc3Nzc3Nzc3Nzc3Nzc3Nzc3Nzc3Nzc3Nzc3N//AABEIALQAwAMBIgACEQEDEQH/xAAcAAEAAgMBAQEAAAAAAAAAAAAABQcCBggEAQP/xAA9EAABAwMBAwkGAwYHAAAAAAAAAQIDBAURBgcSIRMVIjFhYnKhsRRRcYGRwTPC0TI0QUJjglJTVHOSorL/xAAbAQEAAgMBAQAAAAAAAAAAAAAAAQUCBAYHA//EADARAQABAwEGAgoCAwAAAAAAAAABAgMEEQUTIUFxwQZhEhQyUYGRobHR8EPhJTNC/9oADAMBAAIRAxEAPwDUgAYvUgAAAAAAAAAAAAAAAAAAAAAAAAAAAAAAAAAAAAAAAAAAAAAAAAG4aP0HVahgSsqJvZaJVw127l0mOvCe7tJe/wCy6WmpX1Fnq31DmNysErURzvCqfx7Bo0K9qYlF3dVV8f3mrgBUVFwqYVAG+AAAAAAAAAAAAAAAAAAAAAAAAH1jVe9rGplzlwidp8JzRFDzhqq3QKmWpMkjvg3pfYMLtyLduqueUar3tFG232uko2JhIIWs+iHrAMnmNVU1TNU83P8ArqhS36ruMLW7rHS8o1Oxyb33IEsLbJRcld6KtROE8KsVe1q/o5CvTF6Ls67vcW3X5fbgAANwAAAAAAAAAAAAADOCGWolbDBG+SR64axjcqq9iGBbeyCzxRWua7SRos80ixxuVOLWJ14+K5+gaefmRiWJuzGvuVtXafvFvg5etttTDF/jdGuE+PuI06ckY2RjmSNRzHJhzXJlFQ5+1paW2XUdXRxN3Yd7fiTuO4ony6vkJho7L2t65VNuuNJjihAAF0FhbG6HlbvWVrk4QQoxq9rl/Rqlelz7I6H2bTLqlU6VVM539qdFPNFEKnbd7d4dXnw/fg3cAGTg2j7XaL2jTTKlE6VNO1yr3XcF88FMnROqaLnDTtxpcZc+B26neRMp5ohzsYy7Pw9d9LGqo90/f9kAAX4AAAAAAAAAAAAAHRWmKDmzT9BR4w6OFu/4l4r5qpRekqDnPUlvpFTLXTIr/CnFfJDogmHLeJL3sWo69o7hWW2W2ZZQ3RjepVgkXzb+Ys0hNZ2znbTNdSo3MnJ8pH4m8U9MfMlSbOyNxlUV8tePSXPgAMXoh1nRunKLm6w0FHjCxQNR3ixlfPJQ2lqLnHUVvpFTLXzt3k7qcV8kU6KJhy3iS9/rtdZ7R3B19RH6grkttjrqxeuKFzm/HHDzwePRNatw0rbZ3O3n8ijHL2t6K+hLnNzVud7y10+mqcXjwU5w1BRc3Xuuo8YSKd7W/DPDywdHlKbWKL2bVTp0TDaqFsnzTor6IRK78O3fRyKrfvj7NMABDsQAAAAAAAAAAAABYOxyg5a8Vde5OjTxbjV7zl/RF+pbppmyi3+yaWbUOTD6uV0nyTop6L9TcyYcBte9vcyueUcPl/YDSdKaj5w1nfaJz8xq5Fg/s6C4+PBTdiWnkY9div0KvdE/OHPOr7ZzTqSupETEaSK6Pwu4p6kOWXtltm7PQ3RjeD0WCRe1OLfv9CtDF32zsj1jFor56cesN62QUPtGopqpydGlgVUXvO4J5bxchoOx2h5GxVVY5OlUT4TwtT9VU34mHH7avbzNq8uH78Wj7XK/2bTTKVq4dVTI1U7reK+eD8Njtby1jqqRV408+8id1yfqimu7Ya/l77T0TV6NNDlU7zlz6Ih82PVvI6gqKRV4VECqid5q59FUc1pGJ/hvP2v34LiK42zUW/Q2+uanGOR0Tl7HJlP/ACpY5re0Oi9u0hXtRMuiakzf7VyvlkmVJs27usu3V56fPgoUAGL0QAAAAACVtum7zdIUmoLdPNEq4SRG4avzUijeNPbSKy0W2CgkoYaiOBN1jt9WO3fd1KGrl15FFGuPTFU+bxwbOtSzftUkcSf1Jm/ZVJGn2VXh/wCPV0UXwc5y+hNQbWaNce0Wqdnv3JUd6ohIwbT9PyY5RKuHxRIvoqk8FHdytsR/Hp0jXvKGp9kv+pvHyjg/VxIwbKrOz8esrZPgrW/YmqfXemp+q5sYvukY5vqhI0+oLNU/g3Wid2cu3PqOCsu521I9uao+GnZ67fRw2+igo6ZFSGBiMYirlcIee/16Wyy1taq4WGFzm+LHDzwe2OaKVMxSMenva5FK+2tX6nZa22inma+omkR0zWrncYnHj2quPoS0sOxVk5NNE8dZ491eaVui2rUdFXOcu62VElX3tdwd5Kp0P19RzCdAaGufOul6Goc7MjGclJ4m8PPgvzIhfeI8fhRejpPbux17bedNLV0LW5kjZy0fxbx9Mp8ygTp1URyKiplF4KhQVVYXQ62Wy7vRdVoxvgVcov8AxUSjw9lRTRct1cuP57Ll0dQ83aYt1MqYckKOcned0l81Jk+IiNRERMInBEIzVFdzbp64VecOjgdu+JeCeaoS5yfSv3vOqfvKitVV/OeorhVouWvmcjPCnBPJEP00ZW+waottQq4by6McvY7or6kMfWOVj2uauHNXKL7lMXo02KdzueWmn00dOmE0TJ4nxStR0cjVa5q9SovWh47Fc4bvaaaugejklYiux/K7+KL2op7zJ5rVTVRVNM8JhqdTs601PlW0kkKr/lTO++SJqdlFsfn2a4VUXjRr0+xv0s8MCb00scae97kQjKnU9ipfxrtRovubKjl8iFhZzs/+Ouqfr+VfVOyasbn2W6QP93KRq30yRVTs11HDnk4qef8A25k/NgsGp2i6ag/Zq5Jl/pQu++CJqdq9sZ+7W+ql8atZ+o4Lazl7Yn/jXrGn4VzctNXq1wrNX26eKJq4WTGWp80Ik3rUO0mqu9tqKCGgip4527jnK/fdu/xxwRDRSHQYleRXRrkUxTPkAANoAAAAAZMkexcse5vwXBiqqq5VcqoAAszY1c8SV1re7g5EnjTtTg78v0KzJjR9z5o1JQ1ariNJEZJ4XcF9c/INLaOP6xi10c9OHWHQxrFZp/ldeUN4RmY2Uz0evfTg3yd/1NnBk8/tXqrUzNPOJj5hoe2Cv5CwQUbV6VVNxTut4+u6b4U1tdr/AGnUcdI1ctpYURU7zuK+W6RKw2LZ3uZT5cfl/bRgAQ717rZeLlaVcturZqfe/aRjuC/FOo/ap1He6r8e61jk93LORPohFgPnNm1NXpTTGvRlJLJKu9K9z197lyYgB9AAAAAAAAAAAAAAAAAAAdB6LufO2maGpc7MiR8nJ4m8F9M/MmysNjVz/frW93unjTyd+Us8yh53tLH9Xyq6OWusdJFXCZXqOcdRV3Od8rq3OUlmcrfDnCeWC9dYV/NumbjUouHJCrWL3ndFPNTnoiV54bs8K7s9O89gAEOoAAAAAAAAAAAAAAAAAAAAAAAATOjrsll1HR1kjt2FH7kq9x3Bfp1/I6Dje2RjXxuRzHJlrmrlFQ5jJW36kvVtp1p6K5VEUK/yI7KJ8M9XyESpdq7JnMqiuidJjhxWHthu0TLfTWmORFmkkSWRqL+y1OrPxVfIqcznmlqJXTTyPkleuXPe7KqvapgG9gYkYliLUTqAANwAAAAAAAAAAAAAAAAAAAAAAAAAAAAAAAAAAAAAAAAAAAAAAAAAAAAAAAAAAAAAAAAAAAAAAAAAAH//2Q==" />
    <span class="title">Intervals.icu</span>
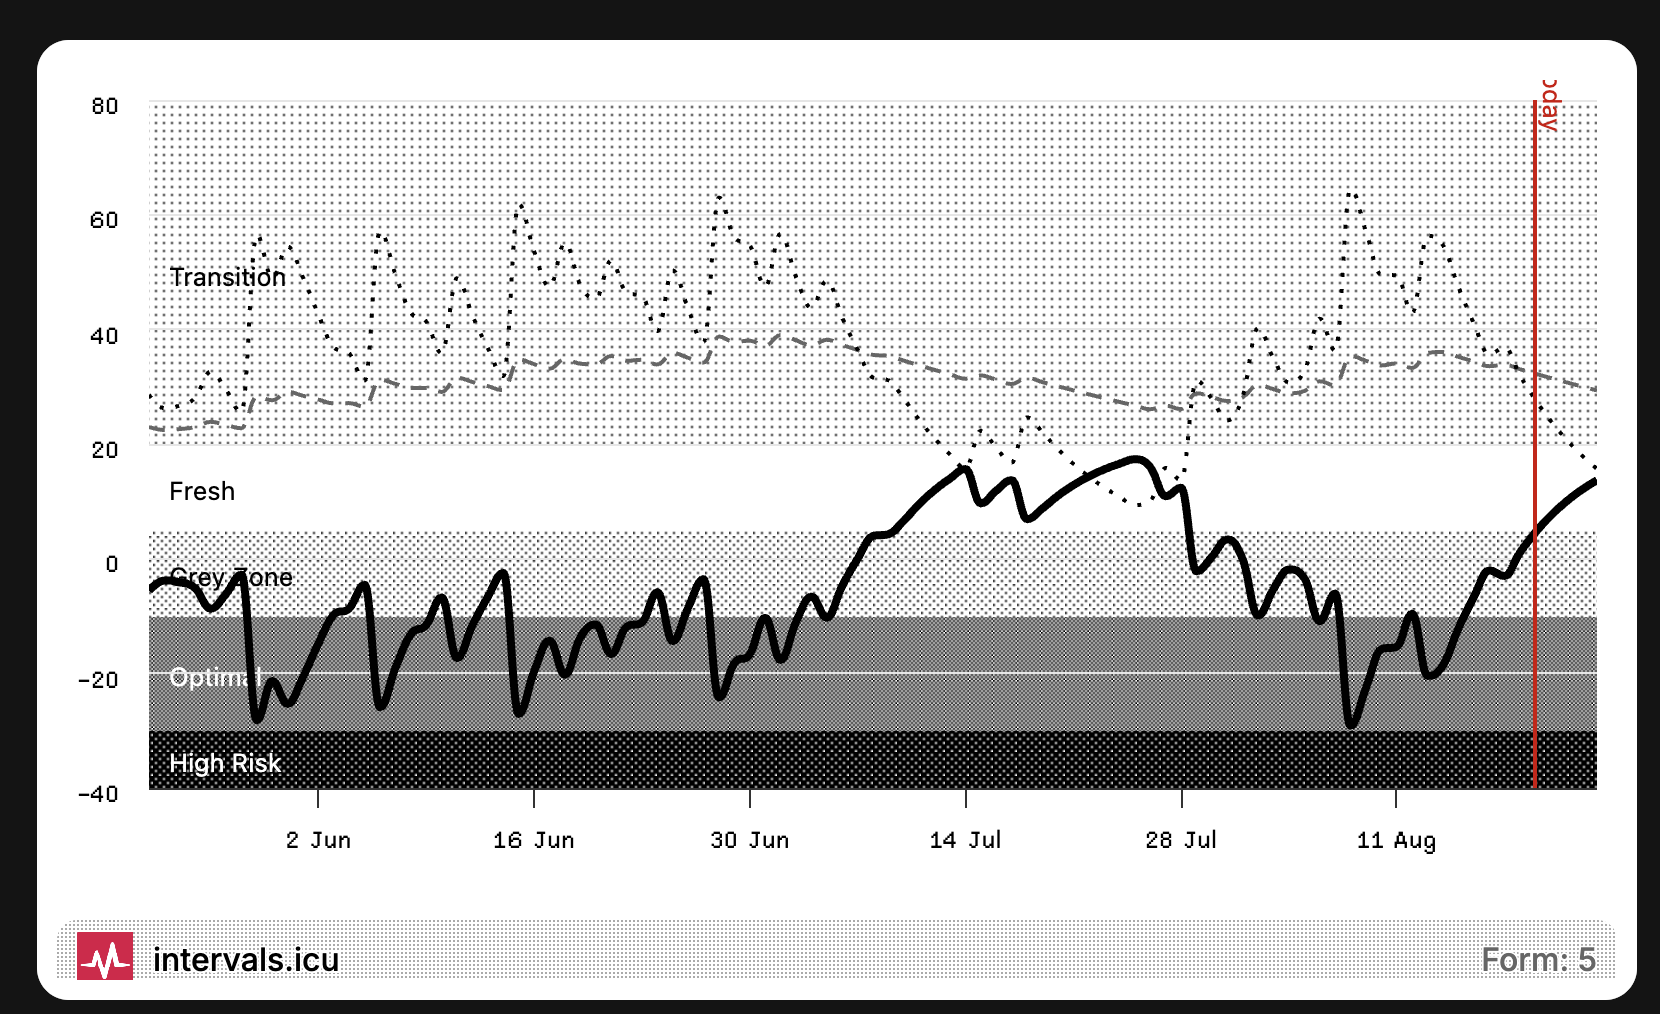
    <span class="instance">TSB Model</span>
  </div>
</div>


<script type="text/javascript">
  // 1) BUILD THE RAW DATA (from Liquid)
  // Now, wellness_data is an array of arrays: [[57,57], [58,62], ...]
  var data = {{ wellness_data | json }};
  
  // 2) Calculate dynamic dates
  var today = new Date();
  today.setHours(0, 0, 0, 0);
  var todayTs = today.getTime();
  
  // Oldest: today minus 90 days
  var oldestTs = todayTs - (90 * 24 * 3600 * 1000);
  // Newest: today plus 5 days
  var newestTs = todayTs + (5 * 24 * 3600 * 1000);
  
  // 3) Validate the data source.
  // Each entry should be an array with at least 2 values: [ctl, atl]
  var validData = data.filter(function(entry) {
    return Array.isArray(entry) && entry.length >= 2;
  });
  
  var n = validData.length;
  // Calculate the time step between data points (evenly spaced)
  var step = n > 1 ? (newestTs - oldestTs) / (n - 1) : 0;
  
  // 4) Build the series arrays for the chart
  var fitnessData = [];
  var fatigueData = [];
  var formData = [];
  
  for (var i = 0; i < n; i++) {
    // Compute an evenly spaced timestamp for each data point and shift it one day forward.
    var ts = Math.floor(oldestTs + i * step) + (24 * 3600 * 1000);
    var ctlValue = Math.round(validData[i][0]);
    var atlValue = Math.round(validData[i][1]);
    var formValue = Math.round(ctlValue - atlValue);
    
    fitnessData.push([ts, ctlValue]);
    fatigueData.push([ts, atlValue]);
    formData.push([ts, formValue]);
  }
  
  // 5) Determine the closest values to today's timestamp
  function findClosestValue(seriesArray, targetTimestamp) {
    if (!seriesArray.length) return null;
    var closest = seriesArray[0];
    for (var i = 1; i < seriesArray.length; i++) {
      var curr = seriesArray[i];
      if (Math.abs(curr[0] - targetTimestamp) < Math.abs(closest[0] - targetTimestamp)) {
        closest = curr;
      }
    }
    return closest[1];
  }
  
  var fitnessToday = findClosestValue(fitnessData, todayTs);
  var fatigueToday = findClosestValue(fatigueData, todayTs);
  var formToday    = findClosestValue(formData, todayTs);
  
  // 6) Create multiSeriesData with series names including today's values
  var multiSeriesData = [
    { name: "Fitness: " + fitnessToday, data: fitnessData },
    { name: "Fatigue: " + fatigueToday, data: fatigueData },
    { name: "Form: " + formToday,       data: formData }
  ];
  
  // 7) Render the combined chart
  new Chartkick.LineChart("chart-combined", multiSeriesData, {
    adapter: "highcharts",
    curve: true,
    colors: ["#000000", "#000000", "#000000"],
    library: {
      chart: {
        height: 400,
        animation: false,
        events: {
          load: function() {
            var s = this.series;
            if (s[0]) { s[0].update({ dashStyle: "Dash", lineWidth: 3 }, false); }
            if (s[1]) { s[1].update({ dashStyle: "Dot", lineWidth: 2 }, false); }
            if (s[2]) { s[2].update({ dashStyle: "Solid", lineWidth: 3 }, false); }
            this.redraw();
          }
        }
      },
      plotOptions: {
        series: { animation: false, lineWidth: 2 }
      },
      legend: {
        enabled: true,
        itemStyle: { fontSize: "16px", color: "#000000", fontWeight: "600" }
      },
      xAxis: {
        type: "datetime",
        // Shift the x-axis boundaries by one day as well
        min: oldestTs + (24 * 3600 * 1000),
        max: newestTs + (24 * 3600 * 1000),
        dateTimeLabelFormats: { day: "%b %e, %Y" },
        labels: { style: { fontSize: "16px", color: "#000000" } },
        tickPixelInterval: 120,
        plotLines: [{
          color: "#000000",
          value: todayTs,
          width: 2,
          dashStyle: "Solid",
          zIndex: 10,
          label: {
            text: '<span class="label label--small label--outline bg-white">Today</span>',
            useHTML: true,
            align: "right",
            verticalAlign: "bottom",
            y: -34,
            x: 10,
          }
        }]
      },
      yAxis: {
        opposite: true,
        labels: { style: { fontSize: "16px", color: "#000000" } },
        softMin: -40,
        softMax: 50,
        tickInterval: 20,
        gridLineWidth: 0,
        gridLineColor: "#000000",
        plotBands: [
          {
            from: -9999,
            to: -30,
            color: {
              pattern: {
                image: "https://usetrmnl.com/images/grayscale/gray-5.png",
                width: 12,
                height: 12
              }
            },
            label: {
              text: '<span class="label label--small label--outline bg--white">High Risk</span>',
              useHTML: true,
              align: "left",
              x: 5
            }
          },
          {
            from: -30,
            to: -10,
            color: {
              pattern: {
                image: "https://usetrmnl.com/images/grayscale/gray-4.png",
                width: 12,
                height: 12
              }
            },
            label: {
              text: '<span class="label label--small label--outline bg--white">Optimal</span>',
              useHTML: true,
              align: "left",
              x: 5
            }
          },
          {
            from: -10,
            to: 5,
            color: {
              pattern: {
                image: "https://usetrmnl.com/images/grayscale/gray-7.png",
                width: 12,
                height: 12
              }
            },
            label: {
              text: '<span class="label label--small label--outline bg--white">Grey Zone</span>',
              useHTML: true,
              align: "left",
              x: 5
            }
          },
          {
            from: 5,
            to: 20,
            color: {
              pattern: {
                image: "https://usetrmnl.com/images/grayscale/white.png",
                width: 12,
                height: 12
              }
            },
            label: {
              text: '<span class="label label--small label--outline bg--white">Fresh</span>',
              useHTML: true,
              align: "left",
              x: 5
            }
          },
          {
            from: 20,
            to: 9999,
            color: {
              pattern: {
                image: "https://usetrmnl.com/images/grayscale/gray-6.png",
                width: 12,
                height: 12
              }
            },
            label: {
              text: '<span class="label label--small label--outline bg--white">Transition</span>',
              useHTML: true,
              align: "left",
              x: 5
            }
          }
        ]
      }
    }
  });
</script>

The only challenge is to get the data in there. I’m using the webhook feature because TRML introduced a limit to not overwhelm their servers, so I had to optimize it. So basically what I’m sending as webhook is an array of arrays: for every day I send the fitness and the fatique. For example this is the payload:

[
  [
    48,
    39
  ],
  [
    49,
    45
  ],
  [
    48,
    39
  ],
  [
    48,
    40
  ],
  [
    47,
    34
  ],
  [
    46,
    31
  ],
  [
    45,
    27
  ],
  [
    46,
    39
  ],
  [
    45,
    34
  ],
  [
    46,
    41
  ],
  [
    45,
    35
  ],
  [
    44,
    31
  ],
  [
    46,
    45
  ],
  [
    48,
    54
  ],
  [
    49,
    60
  ],
  [
    50,
    64
  ],
  [
    49,
    56
  ],
  [
    48,
    48
  ],
  [
    46,
    42
  ],
  [
    48,
    48
  ],
  [
    48,
    53
  ],
  [
    47,
    47
  ],
  [
    48,
    52
  ],
  [
    49,
    57
  ],
  [
    48,
    49
  ],
  [
    48,
    50
  ],
  [
    49,
    57
  ],
  [
    50,
    64
  ],
  [
    51,
    66
  ],
  [
    51,
    62
  ],
  [
    49,
    54
  ],
  [
    48,
    47
  ],
  [
    47,
    41
  ],
  [
    47,
    43
  ],
  [
    48,
    48
  ],
  [
    47,
    43
  ],
  [
    48,
    51
  ],
  [
    49,
    56
  ],
  [
    48,
    49
  ],
  [
    49,
    54
  ],
  [
    48,
    47
  ],
  [
    50,
    57
  ],
  [
    51,
    61
  ],
  [
    52,
    66
  ],
  [
    52,
    65
  ],
  [
    53,
    68
  ],
  [
    51,
    59
  ],
  [
    53,
    66
  ],
  [
    52,
    58
  ],
  [
    53,
    65
  ],
  [
    54,
    69
  ],
  [
    54,
    69
  ],
  [
    56,
    76
  ],
  [
    55,
    66
  ],
  [
    57,
    76
  ],
  [
    55,
    68
  ],
  [
    57,
    73
  ],
  [
    57,
    77
  ],
  [
    58,
    80
  ],
  [
    57,
    69
  ],
  [
    57,
    69
  ],
  [
    57,
    66
  ],
  [
    56,
    57
  ],
  [
    57,
    64
  ],
  [
    58,
    69
  ],
  [
    58,
    69
  ],
  [
    59,
    74
  ],
  [
    58,
    64
  ],
  [
    60,
    75
  ],
  [
    61,
    80
  ],
  [
    62,
    83
  ],
  [
    61,
    73
  ],
  [
    61,
    75
  ],
  [
    63,
    79
  ],
  [
    61,
    69
  ],
  [
    63,
    80
  ],
  [
    64,
    83
  ],
  [
    65,
    86
  ],
  [
    66,
    86
  ],
  [
    64,
    75
  ],
  [
    65,
    80
  ],
  [
    64,
    71
  ],
  [
    69,
    102
  ],
  [
    68,
    88
  ],
  [
    66,
    77
  ],
  [
    67,
    79
  ],
  [
    65,
    68
  ],
  [
    64,
    59
  ],
  [
    64,
    64
  ],
  [
    65,
    68
  ],
  [
    66,
    72
  ],
  [
    64,
    62
  ],
  [
    63,
    54
  ],
  [
    61,
    47
  ],
  [
    60,
    41
  ],
  [
    58,
    35
  ],
  [
    57,
    31
  ]
]

And the plugin code itself calculates the form and also the date. I’m using n8n on my end but I think this could also be done with a simple curl command and .jq (I’m sure AI can help with this fantastically)

The initial query I do to intervals.icu is: [GET] https://intervals.icu/api/v1/athlete/{your_athlate_id_HERE}/wellness.json?oldest={{ new Date(Date.now() - (90 * 24 * 60 * 60 * 1000)).toISOString().slice(0, 10) }}&newest={{ new Date(Date.now() + (6 * 24 * 60 * 60 * 1000)).toISOString().slice(0, 10) }} and the actual payload I send to the TRML server via webhook is:

[
  {
    "message": null,
    "merge_variables": {
      "wellness_data": [
        [
          48,
          39
        ],
        [
          49,
          45
        ],
        [
          48,
          39
        ],
        [
          48,
          40
        ],
        [
          47,
          34
        ],
        [
          46,
          31
        ],
        [
          45,
          27
        ],
        [
          46,
          39
        ],
        [
          45,
          34
        ],
        [
          46,
          41
        ],
        [
          45,
          35
        ],
        [
          44,
          31
        ],
        [
          46,
          45
        ],
        [
          48,
          54
        ],
        [
          49,
          60
        ],
        [
          50,
          64
        ],
        [
          49,
          56
        ],
        [
          48,
          48
        ],
        [
          46,
          42
        ],
        [
          48,
          48
        ],
        [
          48,
          53
        ],
        [
          47,
          47
        ],
        [
          48,
          52
        ],
        [
          49,
          57
        ],
        [
          48,
          49
        ],
        [
          48,
          50
        ],
        [
          49,
          57
        ],
        [
          50,
          64
        ],
        [
          51,
          66
        ],
        [
          51,
          62
        ],
        [
          49,
          54
        ],
        [
          48,
          47
        ],
        [
          47,
          41
        ],
        [
          47,
          43
        ],
        [
          48,
          48
        ],
        [
          47,
          43
        ],
        [
          48,
          51
        ],
        [
          49,
          56
        ],
        [
          48,
          49
        ],
        [
          49,
          54
        ],
        [
          48,
          47
        ],
        [
          50,
          57
        ],
        [
          51,
          61
        ],
        [
          52,
          66
        ],
        [
          52,
          65
        ],
        [
          53,
          68
        ],
        [
          51,
          59
        ],
        [
          53,
          66
        ],
        [
          52,
          58
        ],
        [
          53,
          65
        ],
        [
          54,
          69
        ],
        [
          54,
          69
        ],
        [
          56,
          76
        ],
        [
          55,
          66
        ],
        [
          57,
          76
        ],
        [
          55,
          68
        ],
        [
          57,
          73
        ],
        [
          57,
          77
        ],
        [
          58,
          80
        ],
        [
          57,
          69
        ],
        [
          57,
          69
        ],
        [
          57,
          66
        ],
        [
          56,
          57
        ],
        [
          57,
          64
        ],
        [
          58,
          69
        ],
        [
          58,
          69
        ],
        [
          59,
          74
        ],
        [
          58,
          64
        ],
        [
          60,
          75
        ],
        [
          61,
          80
        ],
        [
          62,
          83
        ],
        [
          61,
          73
        ],
        [
          61,
          75
        ],
        [
          63,
          79
        ],
        [
          61,
          69
        ],
        [
          63,
          80
        ],
        [
          64,
          83
        ],
        [
          65,
          86
        ],
        [
          66,
          86
        ],
        [
          64,
          75
        ],
        [
          65,
          80
        ],
        [
          64,
          71
        ],
        [
          69,
          102
        ],
        [
          68,
          88
        ],
        [
          66,
          77
        ],
        [
          67,
          79
        ],
        [
          65,
          68
        ],
        [
          64,
          59
        ],
        [
          64,
          64
        ],
        [
          65,
          68
        ],
        [
          66,
          72
        ],
        [
          64,
          62
        ],
        [
          63,
          54
        ],
        [
          61,
          47
        ],
        [
          60,
          41
        ],
        [
          58,
          35
        ],
        [
          57,
          31
        ]
      ]
    }
  }
]

Using AI, I’ve created a workflow in Pipedream that pulls data from intervals and then, using @runcaby’s code, I’ve configured a private plugin in TRMNL. FWIW, here’s the stuff :wink:

(1)
create a free account in pipedream, create a workflow with custom http response (copy URL), add node.js trigger, add the following code (add your athlete id and api key), test & deploy

import { axios } from "@pipedream/platform";

export default defineComponent({
  async run({ steps, $ }) {
    const ATHLETE_ID = "YOUR ATHLETE ID"; 
    const API_KEY = "YOUR API KEY";
    const PAST_DAYS = 90;
    const FUTURE_DAYS = 4;

    const credentials = Buffer.from(`API_KEY:${API_KEY}`).toString('base64');
    
    try {
      const requests = [];
      // Loop from 90 days in the past to 4 days in the future
      for (let i = PAST_DAYS; i >= -FUTURE_DAYS; i--) {
        const date = new Date();
        date.setDate(date.getDate() - i);
        const dateString = date.toISOString().slice(0, 10);
        requests.push(
          axios($, {
            method: 'GET',
            url: `https://intervals.icu/api/v1/athlete/${ATHLETE_ID}/wellness/${dateString}`,
            headers: { 'Authorization': `Basic ${credentials}` },
          })
        );
      }

      // Wait for all API calls to settle
      const responses = await Promise.allSettled(requests);
      
      // Filter for successful responses and map to the [fitness, fatigue] format
      const wellnessData = responses
        .filter(res => res.status === 'fulfilled' && res.value.ctl !== undefined)
        .map(res => [res.value.ctl, res.value.atl]);
      
      // The final JSON response Pipedream sends
      const finalJson = {
        // The TRMNL markup expects the data under the key "wellness_data"
        "wellness_data": wellnessData
      };
      
      await $.respond({
        status: 200,
        headers: { "Content-Type": "application/json" },
        body: finalJson,
      });

    } catch (error) {
       console.error("Fehler im Workflow:", error);
       return $.flow.exit(`Ein Fehler ist aufgetreten: ${error.message}`);
    }
  }
})

(2) create a private plugin in TRMNL, add the pipedream URL (poll), open “edit markups” and add the following code:

<script src="https://code.highcharts.com/highcharts.js"></script>
<script src="https://cdn.jsdelivr.net/npm/chartkick@5.0.1/dist/chartkick.min.js"></script>
<script src="https://code.highcharts.com/modules/pattern-fill.js"></script>

<div class="view">
  <div class="layout layout--col">
    <div id="chart-combined" style="width: 100%; height: 400px;"></div>
  </div>

  <div class="title_bar">
    <img class="image" src="https://intervals.icu/logo-120.png" />
    <span class="title">intervals.icu</span>
    <span class="instance" id="form-instance">Form: ...</span>
  </div>
</div>

<script type="text/javascript">
  var createChart = function() {
    var data = {{ wellness_data | json }};
    
    var today = new Date();
    today.setHours(0, 0, 0, 0);
    var todayTs = today.getTime();
    
    var oldestTs = todayTs - (90 * 24 * 3600 * 1000);
    var newestTs = todayTs + (4 * 24 * 3600 * 1000);
    
    var validData = data.filter(function(entry) {
      return Array.isArray(entry) && entry.length >= 2;
    });
    
    var n = validData.length;
    var step = n > 1 ? (newestTs - oldestTs) / (n - 1) : 0;
    
    var fitnessData = [], fatigueData = [], formData = [];
    
    for (var i = 0; i < n; i++) {
      var ts = Math.floor(oldestTs + i * step);
      var ctlValue = validData[i][0];
      var atlValue = validData[i][1];
      var formValue = ctlValue - atlValue;
      
      fitnessData.push([ts, ctlValue]);
      fatigueData.push([ts, atlValue]);
      formData.push([ts, formValue]);
    }
    
    function findClosestValue(seriesArray, targetTimestamp) {
      if (!seriesArray.length) return 'N/A';
      var closest = seriesArray.reduce((prev, curr) => 
        Math.abs(curr[0] - targetTimestamp) < Math.abs(prev[0] - targetTimestamp) ? curr : prev
      );
      return Math.round(closest[1]);
    }
    
    var formToday = findClosestValue(formData, todayTs);
    document.getElementById('form-instance').textContent = "Form: " + formToday;
    
    var multiSeriesData = [
      { name: "Fitness", data: fitnessData, dashStyle: "Dash", lineWidth: 2 },
      { name: "Fatigue", data: fatigueData, dashStyle: "Dot", lineWidth: 2 },
      { name: "Form", data: formData, dashStyle: "Solid", lineWidth: 4 }
    ];
    
    new Chartkick.LineChart("chart-combined", multiSeriesData, {
      adapter: "highcharts",
      curve: true,
      colors: ["#666666", "#000000", "#000000"],
      library: {
        chart: { height: 400, animation: false },
        plotOptions: { series: { animation: false } },
        legend: { enabled: false },
        xAxis: {
          type: "datetime",
          min: oldestTs,
          max: newestTs,
          labels: { style: { fontSize: "16px", color: "#000000" } },
          plotLines: [{
            color: "#d10000", value: todayTs, width: 2, zIndex: 10,
            label: { text: 'Today', align: "right", y: 16, style: { color: '#d10000' } }
          }]
        },
        yAxis: {
          opposite: false,
          labels: { style: { fontSize: "16px", color: "#000000" } },
          title: { text: null },
          plotBands: [
            { from: -999, to: -30, color: { pattern: { image: "https://usetrmnl.com/images/grayscale/gray-2.png", width: 12, height: 12 }}, label: { text: 'High Risk', style: { color: '#FFFFFF' } } },
            { from: -30, to: -10, color: { pattern: { image: "https://usetrmnl.com/images/grayscale/gray-4.png", width: 12, height: 12 }}, label: { text: 'Optimal', style: { color: '#FFFFFF' } } },
            { from: -10, to: 5, color: { pattern: { image: "https://usetrmnl.com/images/grayscale/gray-6.png", width: 12, height: 12 }}, label: { text: 'Grey Zone', style: { color: '#000' } } },
            { from: 5, to: 20, color: { pattern: { image: "https://usetrmnl.com/images/grayscale/white.png", width: 12, height: 12 }}, label: { text: 'Fresh', style: { color: '#000' } } },
            { from: 20, to: 999, color: { pattern: { image: "https://usetrmnl.com/images/grayscale/gray-7.png", width: 12, height: 12 }}, label: { text: 'Transition', style: { color: '#000' } } }
          ]
        }
      }
    });
  };
  
  if ("Chartkick" in window) {
    createChart();
  } else {
    window.addEventListener("chartkick:load", createChart, true);
  }
</script>


(post deleted by author)

I was sick this week (as you see in the screenshot), and I spent some time to build an activity dashboard. I also found a way to let TRMNL poll directly, so no additional hosted service is needed anymore. Just some Markup code to render the dashboards/graphs directly on TRMNL. Works pretty well.

Funny. Everything in english, except the weekdays :wink:
But really nice. Now I want this thing too :smiley:

Is there some Github where you share your code or parts of it?

Ha, good catch. Easy to fix. Here’s what it looks like IRL, after some more fine-tuning.

Reg code - I’m not on Github. But happy to share a short how-to later here…

1 Like

So here’s the how-to (thanks Gemini). Includes a little fix of the wrong % value for Strength. Also be aware that the markup code filters only for rides, runs and strenght workouts, since this is what I want to track.

I wish I could poll with a dynamic date range, like: give me the last 60 days. But couldn’t find a way when using only TRMNL. The current workaround is to send a date for “oldest” to limit load. Makes sense to adjust this every 6 months or so.

How-To: TRMNL Weekly Review Dashboard

This little dashboard gives you an at-a-glance summary of your week’s activities, comparing key metrics like distance and session count against the previous week. It also shows a consistency bar for your training days.

1. TRMNL Private Plugin Setup

In your TRMNL account, create a new “Private Plugin” with the following settings:

  • Strategy: Polling
  • Polling URL(s): Use the activities endpoint. To keep the data load reasonable, it’s best to only fetch data from a fixed start date (e.g., the beginning of the year). The API will automatically fetch everything from that date until today.
    https://intervals.icu/api/v1/athlete/YOUR_ATHLETE_ID/activities?oldest=2025-01-01
    
  • Polling Headers: You need to provide your API key using HTTP Basic Authentication. The header should be a single line:
    Authorization=Basic YOUR_BASE64_KEY
    
    To get your YOUR_BASE64_KEY, you need to Base64-encode the string API_KEY:YOUR_PERSONAL_API_KEY.

2. Markup Code

Copy and paste the entire code below into the “Markup” field of your TRMNL plugin. It handles all the logic for calculating the weekly totals, comparing them, and displaying everything nicely.

{% if data.size > 0 %}

  {%- liquid
    # --- 1. DEFINE WEEKS ---
    # CORRECTED: Use the TRMNL system timestamp to determine the current week.
    # This ensures the dashboard resets correctly on Monday morning.
    assign this_week_number = trmnl.system.timestamp_utc | date: '%W' | plus: 0
    assign last_week_number = this_week_number | minus: 1
    
    # Initialize activity strings for each day of the week
    assign day1_activities = ''
    assign day2_activities = ''
    assign day3_activities = ''
    assign day4_activities = ''
    assign day5_activities = ''
    assign day6_activities = ''
    assign day7_activities = ''

    # --- 2. INITIALIZE COUNTERS ---
    assign this_week_ride_km = 0
    assign this_week_run_km = 0
    assign this_week_strength_sessions = 0
    assign last_week_ride_km = 0
    assign last_week_run_km = 0
    assign last_week_strength_sessions = 0

    # --- 3. CALCULATE DATA ---
    for activity in data
      assign activity_week = activity.start_date_local | date: '%W' | plus: 0
      if activity_week == this_week_number
        
        # Add activity text to the correct day string
        assign day_of_week = activity.start_date_local | date: '%u' | plus: 0
        assign activity_text = ''
        case activity.type
          when "Ride", "VirtualRide"
            assign distance_km = activity.distance | divided_by: 1000.0 | round: 1
            assign activity_text = 'Ride ' | append: distance_km | append: ' km<br>'
          when "Run", "VirtualRun"
            assign distance_km = activity.distance | divided_by: 1000.0 | round: 1
            assign activity_text = 'Run ' | append: distance_km | append: ' km<br>'
          when "WeightTraining"
            assign activity_text = 'Strength<br>'
        endcase

        case day_of_week
          when 1
            assign day1_activities = day1_activities | append: activity_text
          when 2
            assign day2_activities = day2_activities | append: activity_text
          when 3
            assign day3_activities = day3_activities | append: activity_text
          when 4
            assign day4_activities = day4_activities | append: activity_text
          when 5
            assign day5_activities = day5_activities | append: activity_text
          when 6
            assign day6_activities = day6_activities | append: activity_text
          when 7
            assign day7_activities = day7_activities | append: activity_text
        endcase

        case activity.type
          when "Ride", "VirtualRide"
            assign distance_km = activity.distance | divided_by: 1000.0
            assign this_week_ride_km = this_week_ride_km | plus: distance_km
          when "Run", "VirtualRun"
            assign distance_km = activity.distance | divided_by: 1000.0
            assign this_week_run_km = this_week_run_km | plus: distance_km
          when "WeightTraining"
            assign this_week_strength_sessions = this_week_strength_sessions | plus: 1
        endcase
      elsif activity_week == last_week_number
        case activity.type
          when "Ride", "VirtualRide"
            assign distance_km = activity.distance | divided_by: 1000.0
            assign last_week_ride_km = last_week_ride_km | plus: distance_km
          when "Run", "VirtualRun"
            assign distance_km = activity.distance | divided_by: 1000.0
            assign last_week_run_km = last_week_run_km | plus: distance_km
          when "WeightTraining"
            assign last_week_strength_sessions = last_week_strength_sessions | plus: 1
        endcase
      endif
    endfor

    # --- 4. DIFFERENCES ---
    assign ride_change = this_week_ride_km | minus: last_week_ride_km
    assign run_change = this_week_run_km | minus: last_week_run_km
    assign strength_change = this_week_strength_sessions | minus: last_week_strength_sessions

    # --- 5. PERCENTAGE CHANGE ---
    if last_week_ride_km > 0
      assign ride_pct = ride_change | times: 100.0 | divided_by: last_week_ride_km
    else
      assign ride_pct = 0
    endif

    if last_week_run_km > 0
      assign run_pct = run_change | times: 100.0 | divided_by: last_week_run_km
    else
      assign run_pct = 0
    endif

    if last_week_strength_sessions > 0
      assign strength_pct = strength_change | times: 100.0 | divided_by: last_week_strength_sessions
    else
      assign strength_pct = 0
    endif
  -%}

  <div style="padding:16px; text-align:center; font-family: 'Plex Sans', sans-serif;">
    
    <div style="display:flex; justify-content:space-between; gap:16px;">
      
      <div style="flex:1; border:1px solid #000; border-radius:12px; padding:16px;">
        <div style="font-size:24px; font-weight:bold;">Cycling</div>
        <div style="font-size:56px; font-weight:bold; margin:8px 0;">
          {{ this_week_ride_km | round: 1 }}
        </div>
        <div style="font-size:18px;">km this week</div>
        <div style="font-size:16px; color:#444; margin-top:4px;">Last wk: {{ last_week_ride_km | round: 1 }}</div>
        <div style="margin-top:12px;">
          {% if ride_change > 0 %}
            <span style="font-size:24px; font-weight:bold;">▲ {{ ride_pct | round: 0 }}%</span><br>
            <span style="font-size:16px; color:#444;">+{{ ride_change | round: 1 }}</span>
          {% elsif ride_change < 0 %}
            <span style="font-size:24px; font-weight:bold;">▼ {{ ride_pct | round: 0 }}%</span><br>
            <span style="font-size:16px; color:#444;">{{ ride_change | round: 1 }}</span>
          {% else %}
            <span style="font-size:20px; font-weight:bold;">▶ same</span>
          {% endif %}
        </div>
      </div>

      <div style="flex:1; border:1px solid #000; border-radius:12px; padding:16px;">
        <div style="font-size:24px; font-weight:bold;">Running</div>
        <div style="font-size:56px; font-weight:bold; margin:8px 0;">
          {{ this_week_run_km | round: 1 }}
        </div>
        <div style="font-size:18px;">km this week</div>
        <div style="font-size:16px; color:#444; margin-top:4px;">Last wk: {{ last_week_run_km | round: 1 }}</div>
        <div style="margin-top:12px;">
          {% if run_change > 0 %}
            <span style="font-size:24px; font-weight:bold;">▲ {{ run_pct | round: 0 }}%</span><br>
            <span style="font-size:16px; color:#444;">+{{ run_change | round: 1 }}</span>
          {% elsif run_change < 0 %}
            <span style="font-size:24px; font-weight:bold;">▼ {{ run_pct | round: 0 }}%</span><br>
            <span style="font-size:16px; color:#444;">{{ run_change | round: 1 }}</span>
          {% else %}
            <span style="font-size:20px; font-weight:bold;">▶ same</span>
          {% endif %}
        </div>
      </div>

      <div style="flex:1; border:1px solid #000; border-radius:12px; padding:16px;">
        <div style="font-size:24px; font-weight:bold;">Strength</div>
        <div style="font-size:56px; font-weight:bold; margin:8px 0;">
          {{ this_week_strength_sessions }}
        </div>
        <div style="font-size:18px;">workouts</div>
        <div style="font-size:16px; color:#444; margin-top:4px;">Last wk: {{ last_week_strength_sessions }}</div>
        <div style="margin-top:12px;">
          {% if strength_change > 0 %}
            <span style="font-size:24px; font-weight:bold;">▲ {{ strength_pct | round: 0 }}%</span><br>
            <span style="font-size:16px; color:#444;">+{{ strength_change }}</span>
          {% elsif strength_change < 0 %}
            <span style="font-size:24px; font-weight:bold;">▼ {{ strength_pct | round: 0 }}%</span><br>
            <span style="font-size:16px; color:#444;">{{ strength_change }}</span>
          {% else %}
            <span style="font-size:20px; font-weight:bold;">▶ same</span>
          {% endif %}
        </div>
      </div>
    </div>

    <div style="margin-top: 24px;">
      <h3 style="font-size: 16px; color: #444; font-weight: bold;">CONSISTENCY THIS WEEK</h3>
      <div style="display: flex; justify-content: space-between; text-align: center; margin-top: 8px; gap: 8px; align-items: start;">
        
        {%- assign days = "Mon,Tue,Wed,Thu,Fri,Sat,Sun" | split: ',' -%}
        {%- assign day_vars = day1_activities | append: '---' | append: day2_activities | append: '---' | append: day3_activities | append: '---' | append: day4_activities | append: '---' | append: day5_activities | append: '---' | append: day6_activities | append: '---' | append: day7_activities | split: '---' -%}

        {%- for i in (0..6) -%}
          <div style="flex: 1;">
            {%- if day_vars[i] != blank -%}
              <div style="padding: 12px 6px; background-color: #000; color: #fff; border-radius: 4px; border: 1px solid #000; font-size: 16px;">{{ days[i] }}</div>
              <div style="font-size: 16px; line-height: 1.2; margin-top: 4px; color: #000;">{{ day_vars[i] }}</div>
            {%- else -%}
              <div style="padding: 12px 6px; border: 1px solid #000; color: #000; border-radius: 4px; font-size: 16px;">{{ days[i] }}</div>
            {%- endif -%}
          </div>
        {%- endfor -%}
        
      </div>
    </div>
  </div>

{% else %}
  <div style="padding:16px; text-align:center;">
    <h2 style="font-weight:bold; color:red;">Error</h2>
    <p style="color:#444;">Could not receive activity data.</p>
  </div>
{% endif %}
1 Like