Does anyone know how to do this? I would like to plot my weekly quantity of KJ done at or above zone two.
1 Like
Intervals.icu doesn’t have a built-in feature to directly plot weekly KJ done at or above a specific zone.
it should
You could do it manually by altering the FTP of the activities to the top of Z2 and then seeing what the field KJ’s over FTP was and then changing the ftp back again.
2 Likes
I’ve created a custom field for you called ‘Work over z2’, you’ll be able to find it by going:
Custom>🔎Field on an activity.
From there you will need to create the chart on compare with something like this
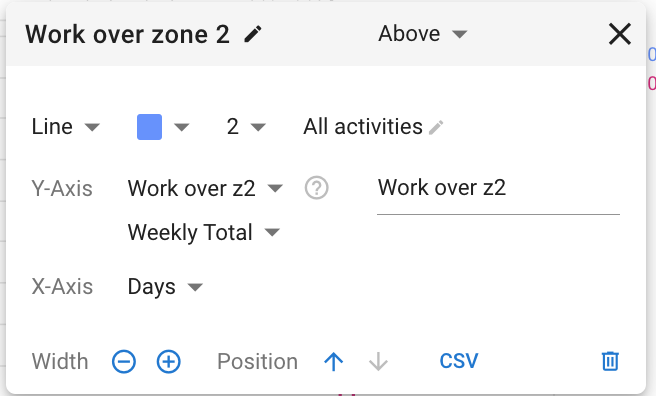
N.B. you will likely need to reprocess some history first too
1 Like
Wow, that’s awesome. Do I need to do that for every activity now? What about new ones as they come in?
once you’ve added it all new activities will calculate it ![]()
Wow that’s awesome. Im going to pull it into my dataset from the API and see what sort of patterns some machine learning algorithms can spot. Specifically, how much load elicits changes in efficiency. Exciting stuff from this app.
BTW, is there any documentation for that script so I can make my own?
What’s wild is that my recent race had 950kj out of 1270 fall within that work over zone 2 range. I guess we know why it’s such a good training technique to do lots of z2.
1 Like
Search for a topic ´Extending Intervals´