I was thinking about a little features that could be used to keep motivation and to track the link between training (fitness, fatigue, form) and best power records. This could help the analysis of the configuration (fitness/fatigue) that is optimal for each athlete to perform breakthrough.
You could add the option to show the days on which the athlete performed a “best effort” on the first graphic of the “Fitness” page. Maybe you could let the user choose what “best effort” he wants to track, or just consider all the best efforts he selected on the page “Power”.
To show these days I think you could draw a gold medal above the fitness curve.
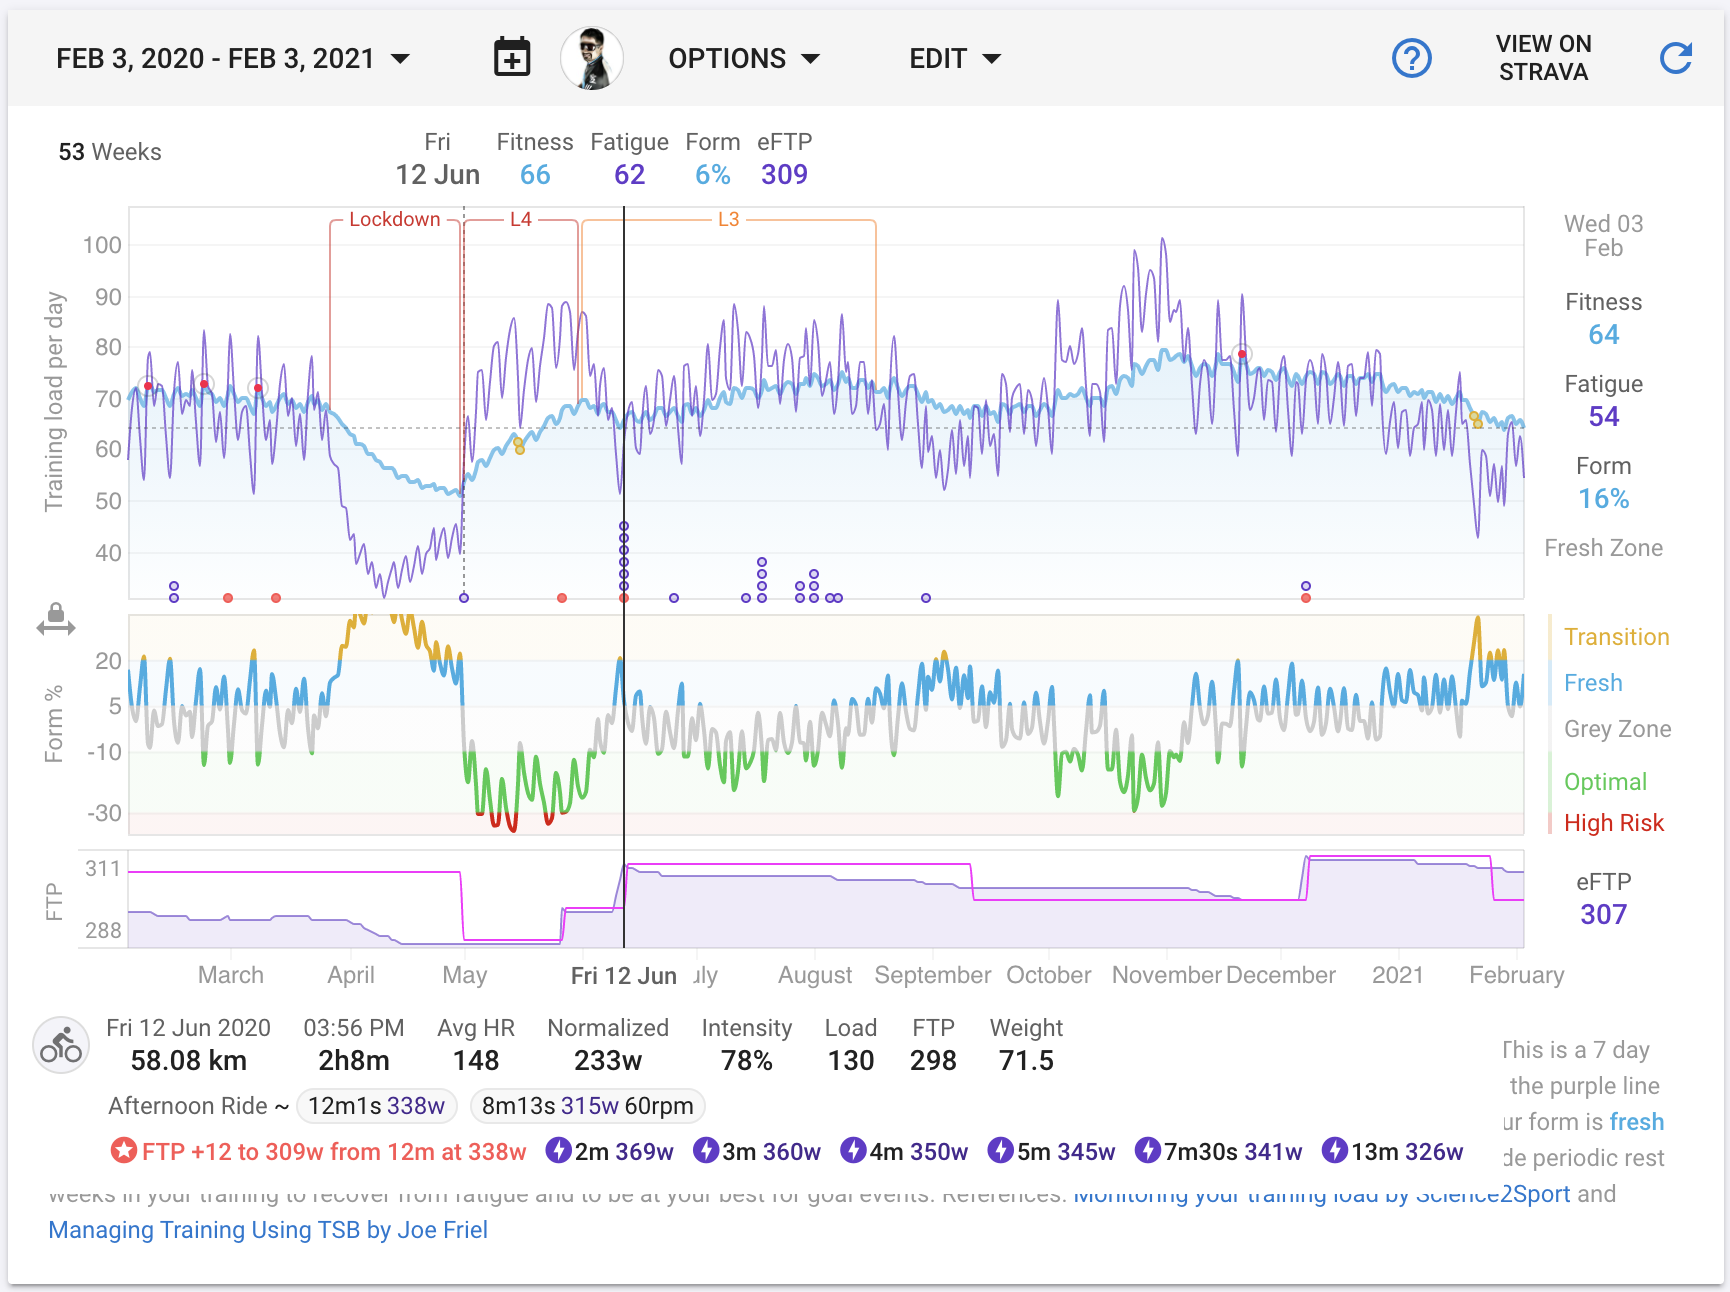
This just got done. Achievements (ftp up, best power for season etc.) are now shown as little stacked dots under the fitness chart and with the activity summary at the bottom:
If you want to make notes of your season for example “Base 1” “Base 2” “Pré Season” in fitness page select “Add entry to calendar” select “Category” For example Notes, start and end date, color and description.
Next “Options” and check “Notes” and you are done
Hi, so I always start with a very low power beginning of the year and gradually work it up. May I know if the dots are life long or per season? e.g. Last year my FTP went up to 180W, but this year I started from 160W. Will I get a red dot when I break through 160W now?
 above the fitness curve.