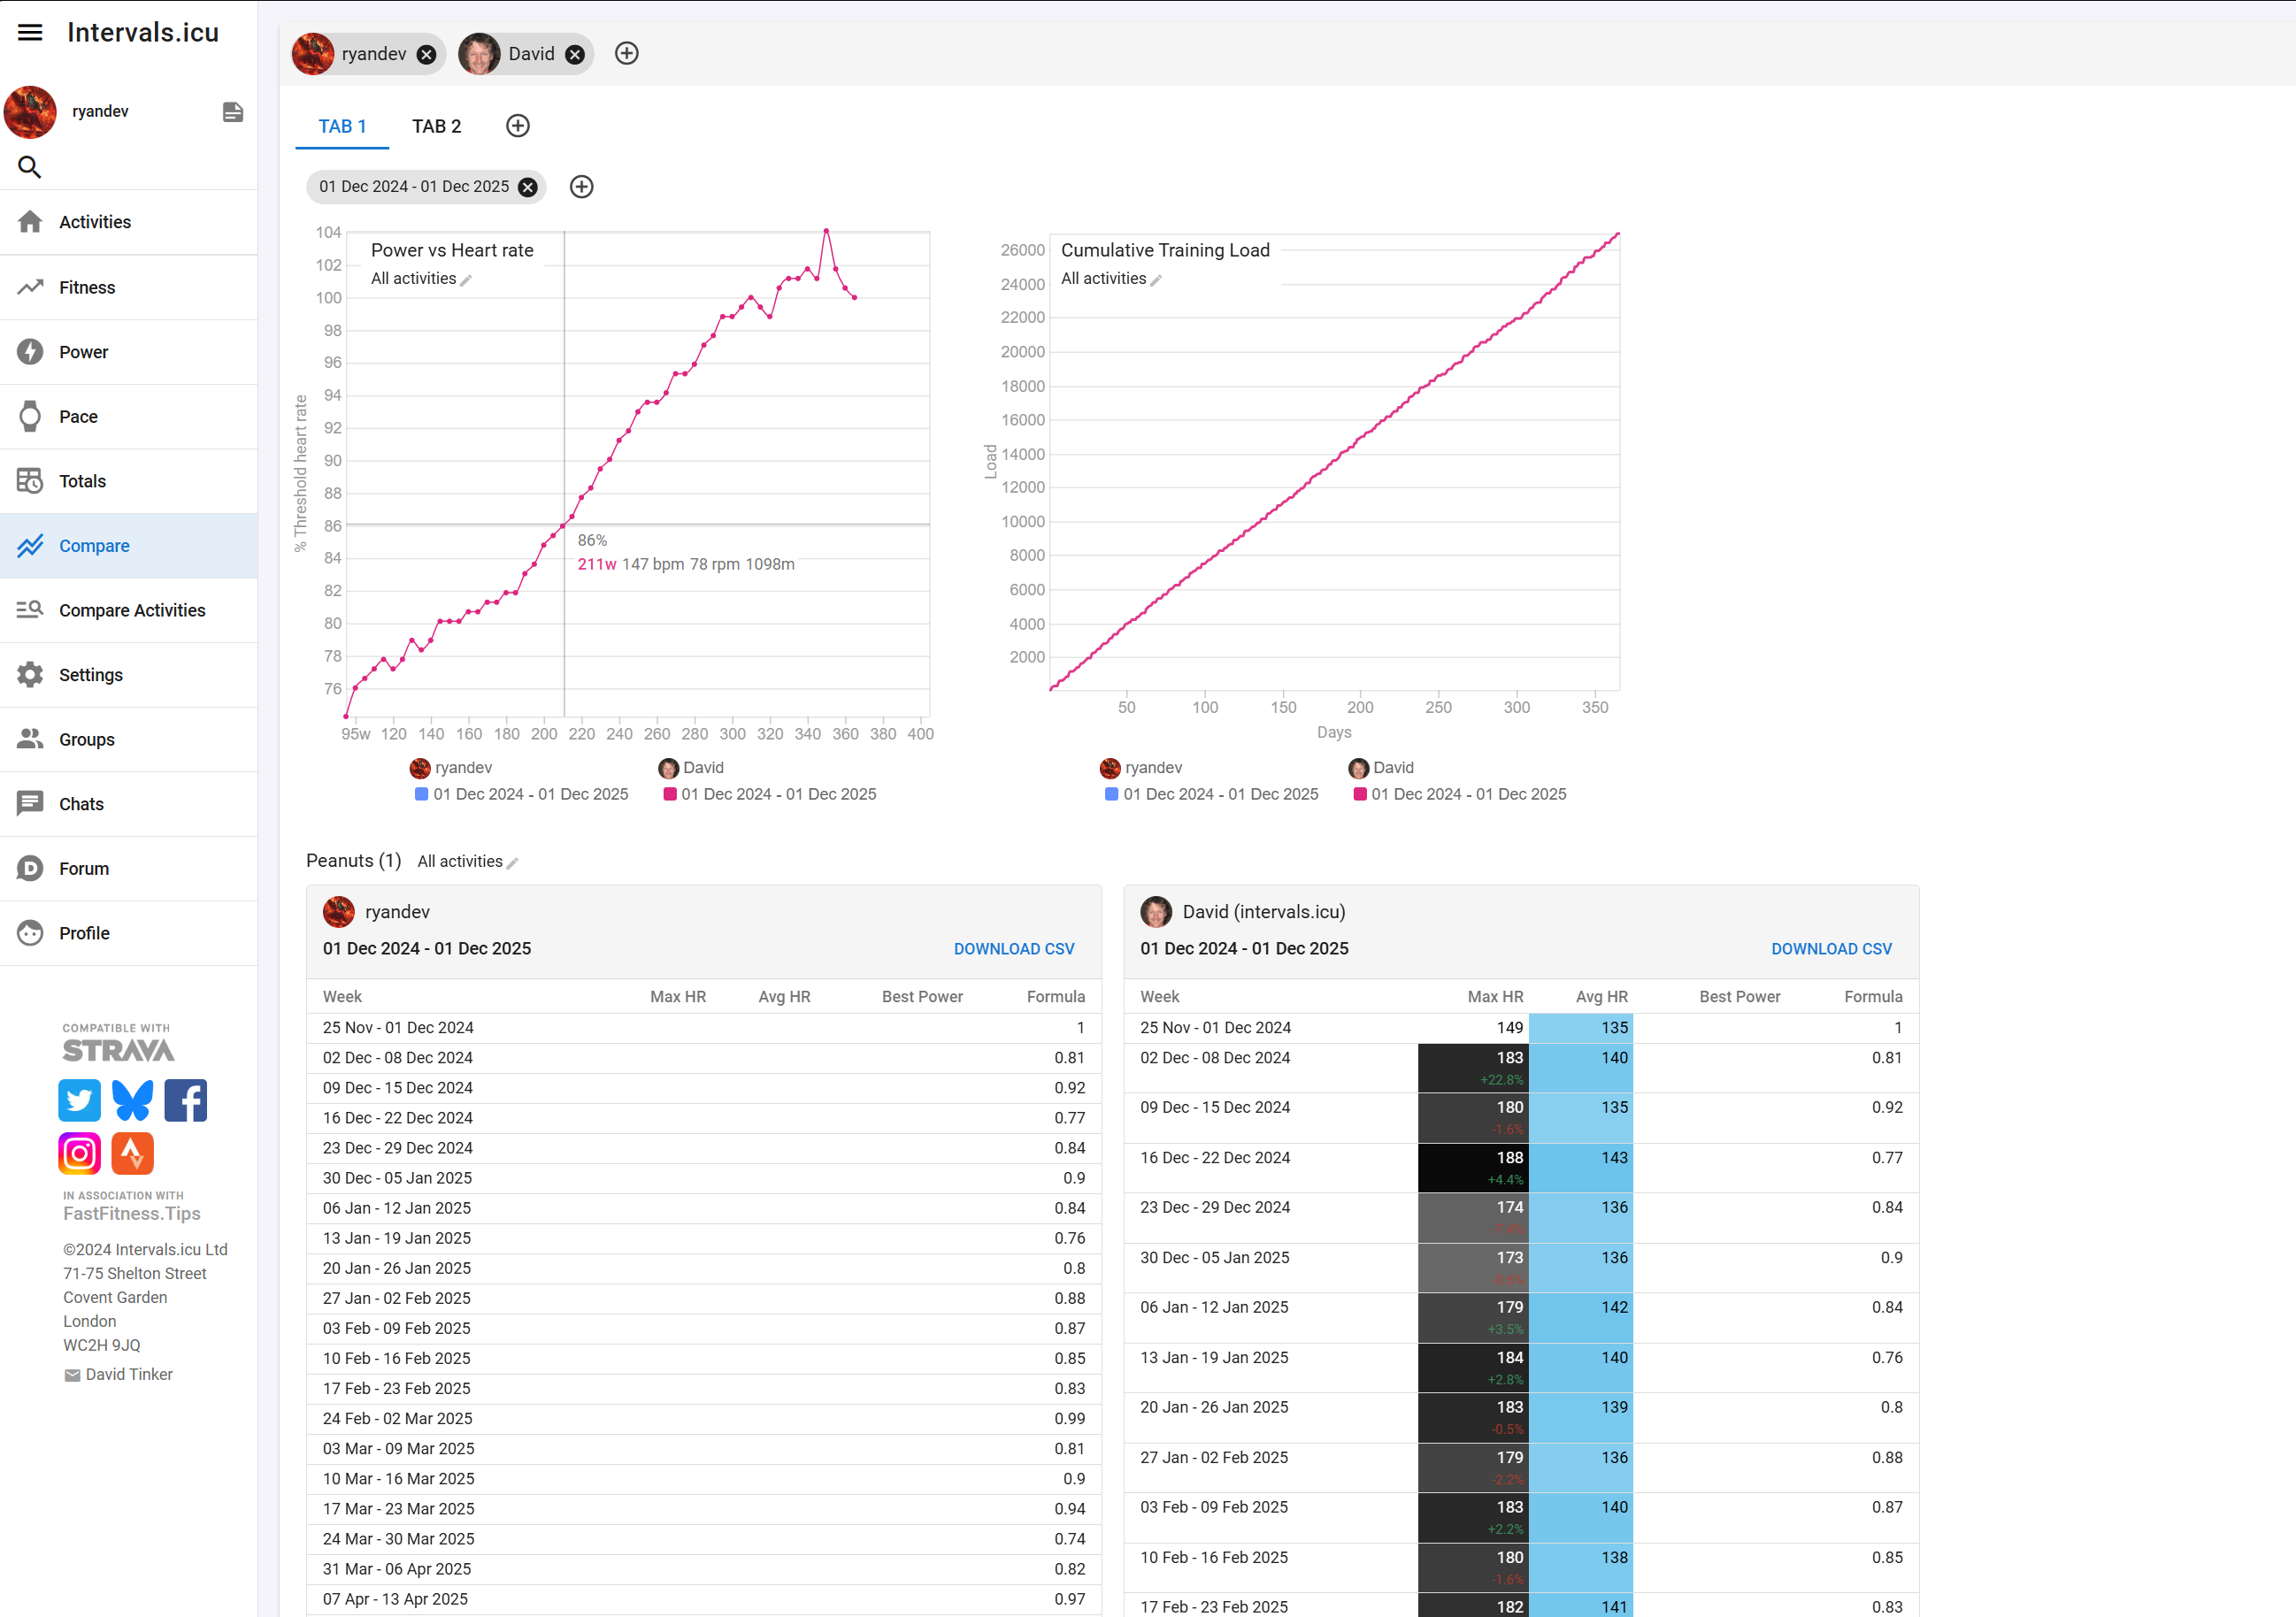
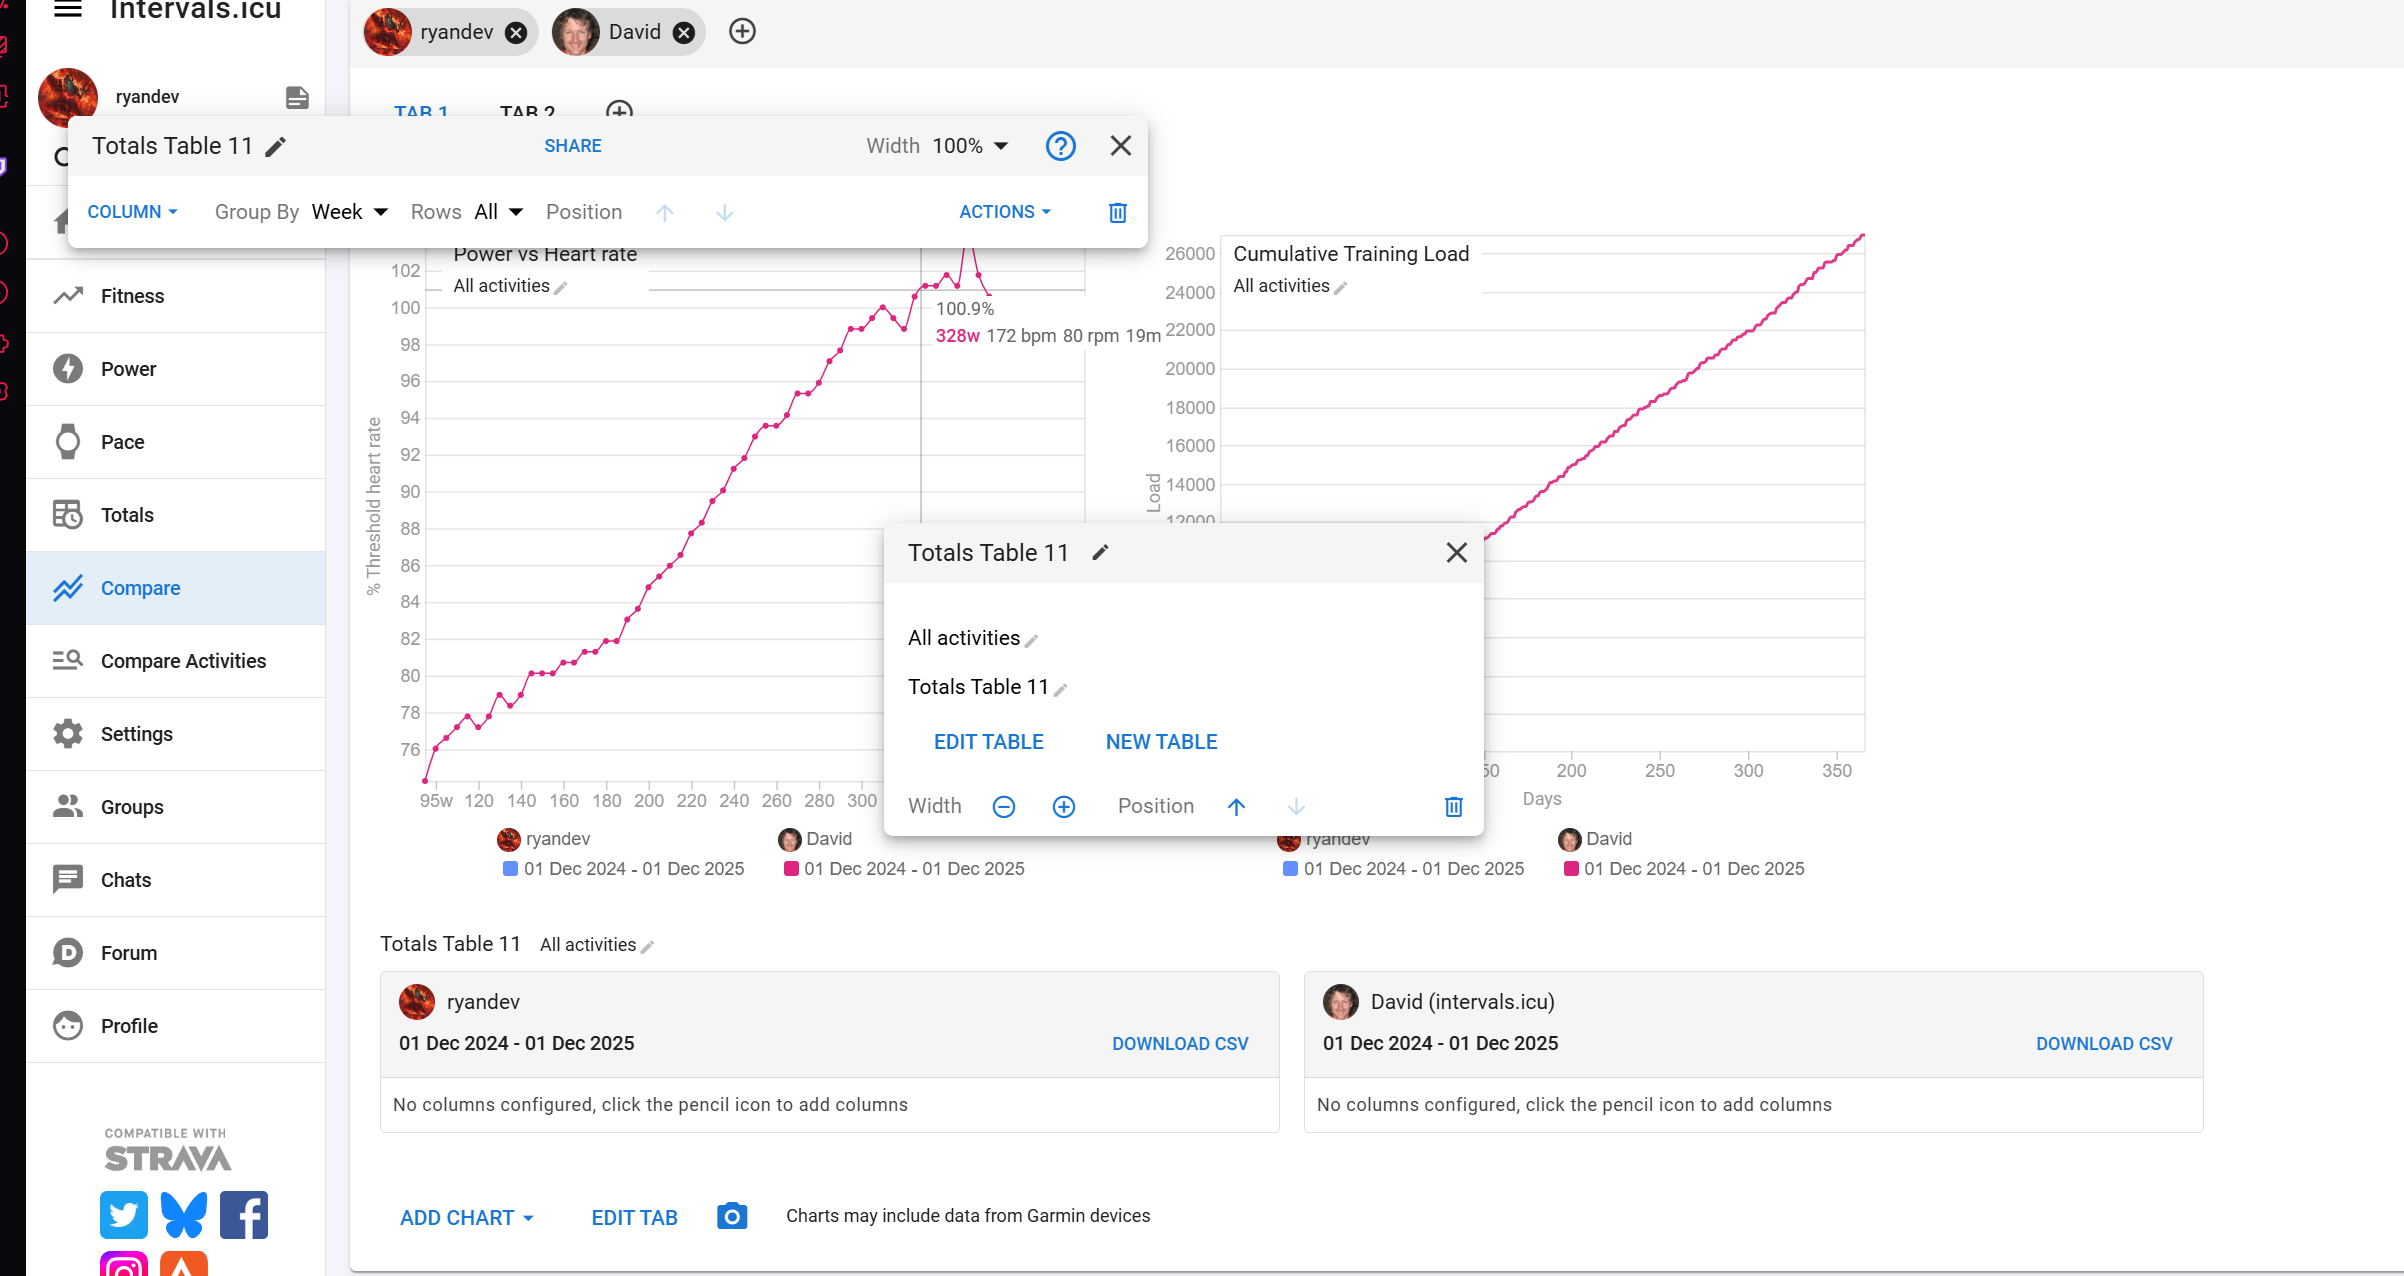
You can now use totals tables to compare athletes or time periods on the compare page!
This uses the same tables as the fitness and totals page and works similarly.
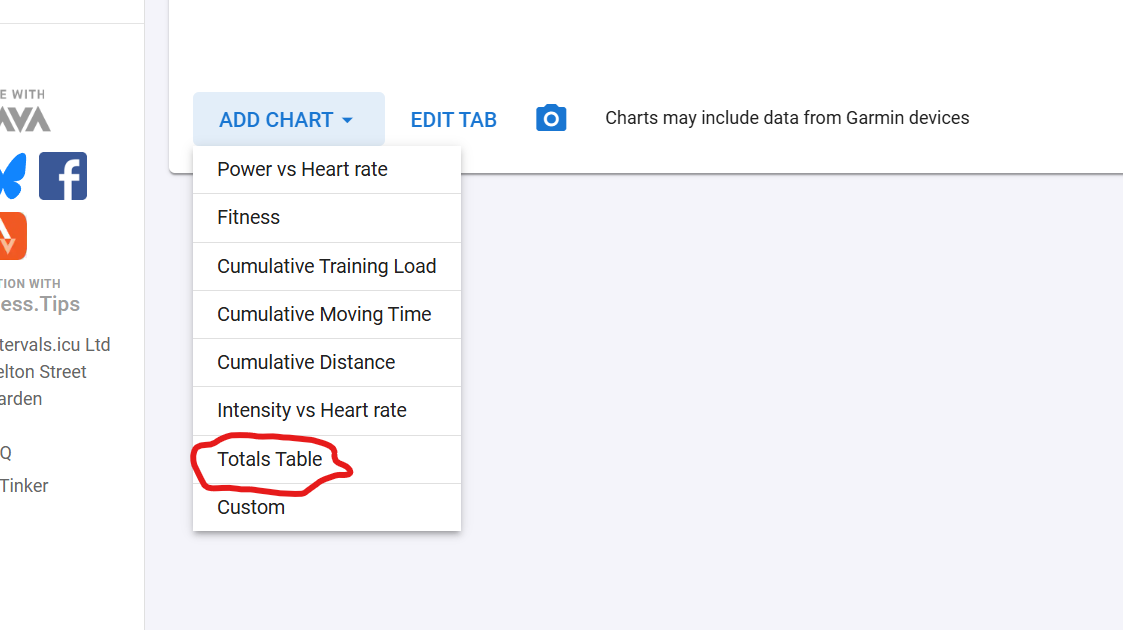
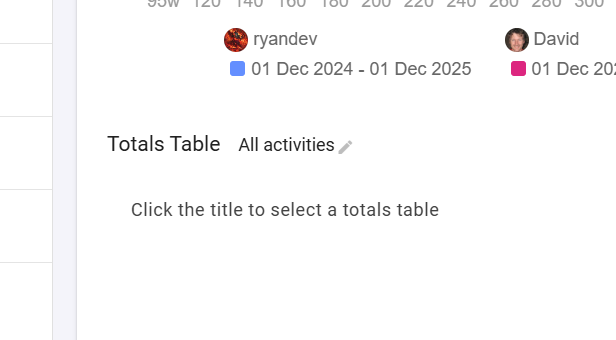
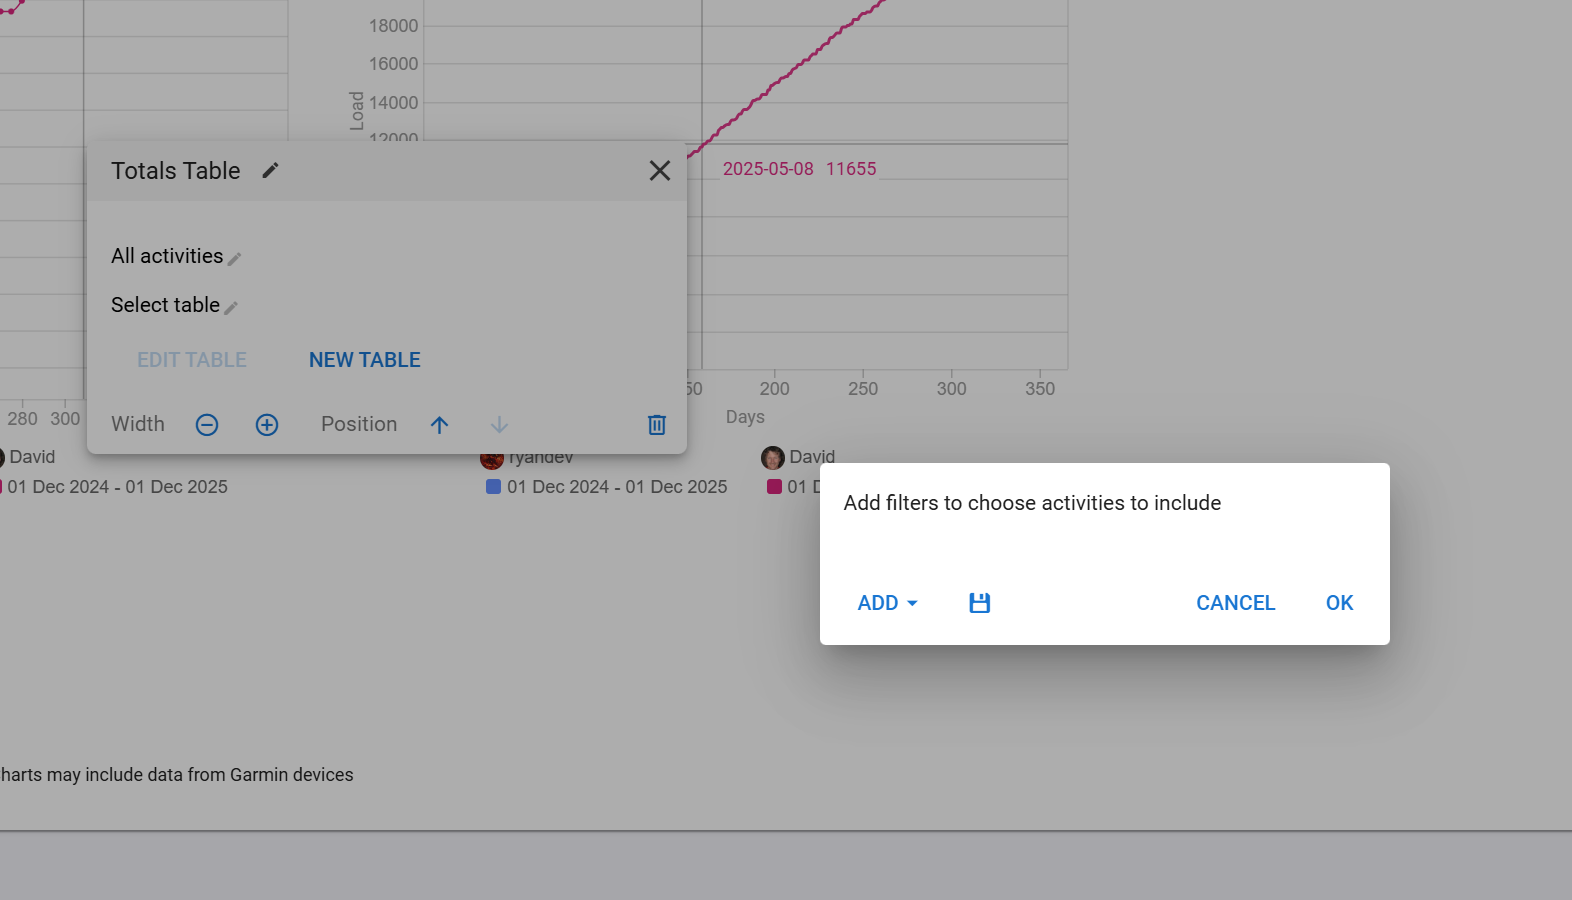
You can add a table by coming down to the add chart button and selecting Totals Table.
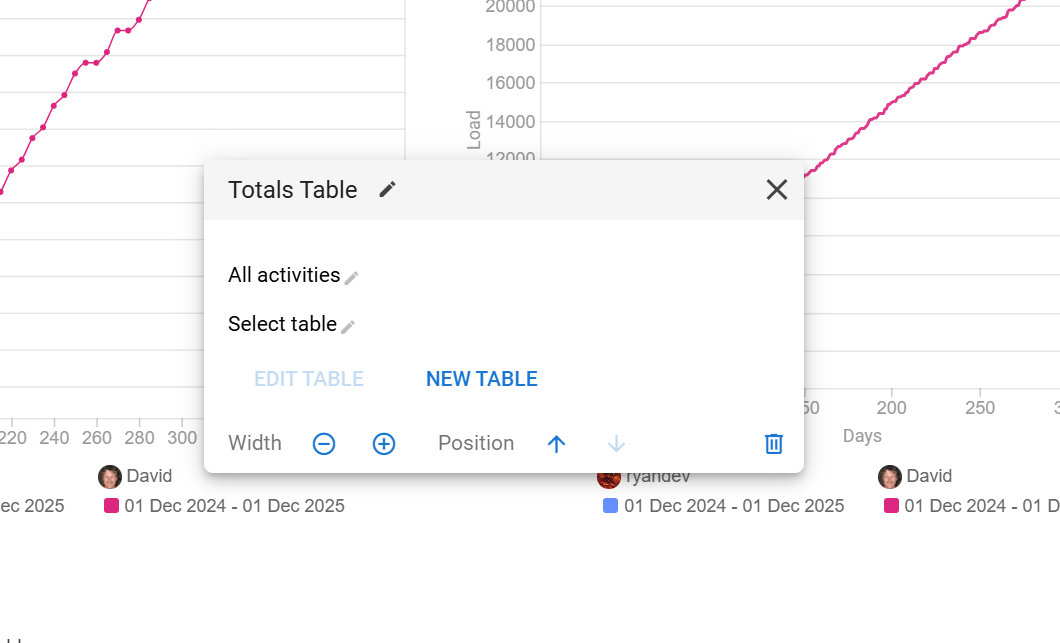
Then edit the new table or select an existing table by going to the pen edit icon.
From here you can filter activities
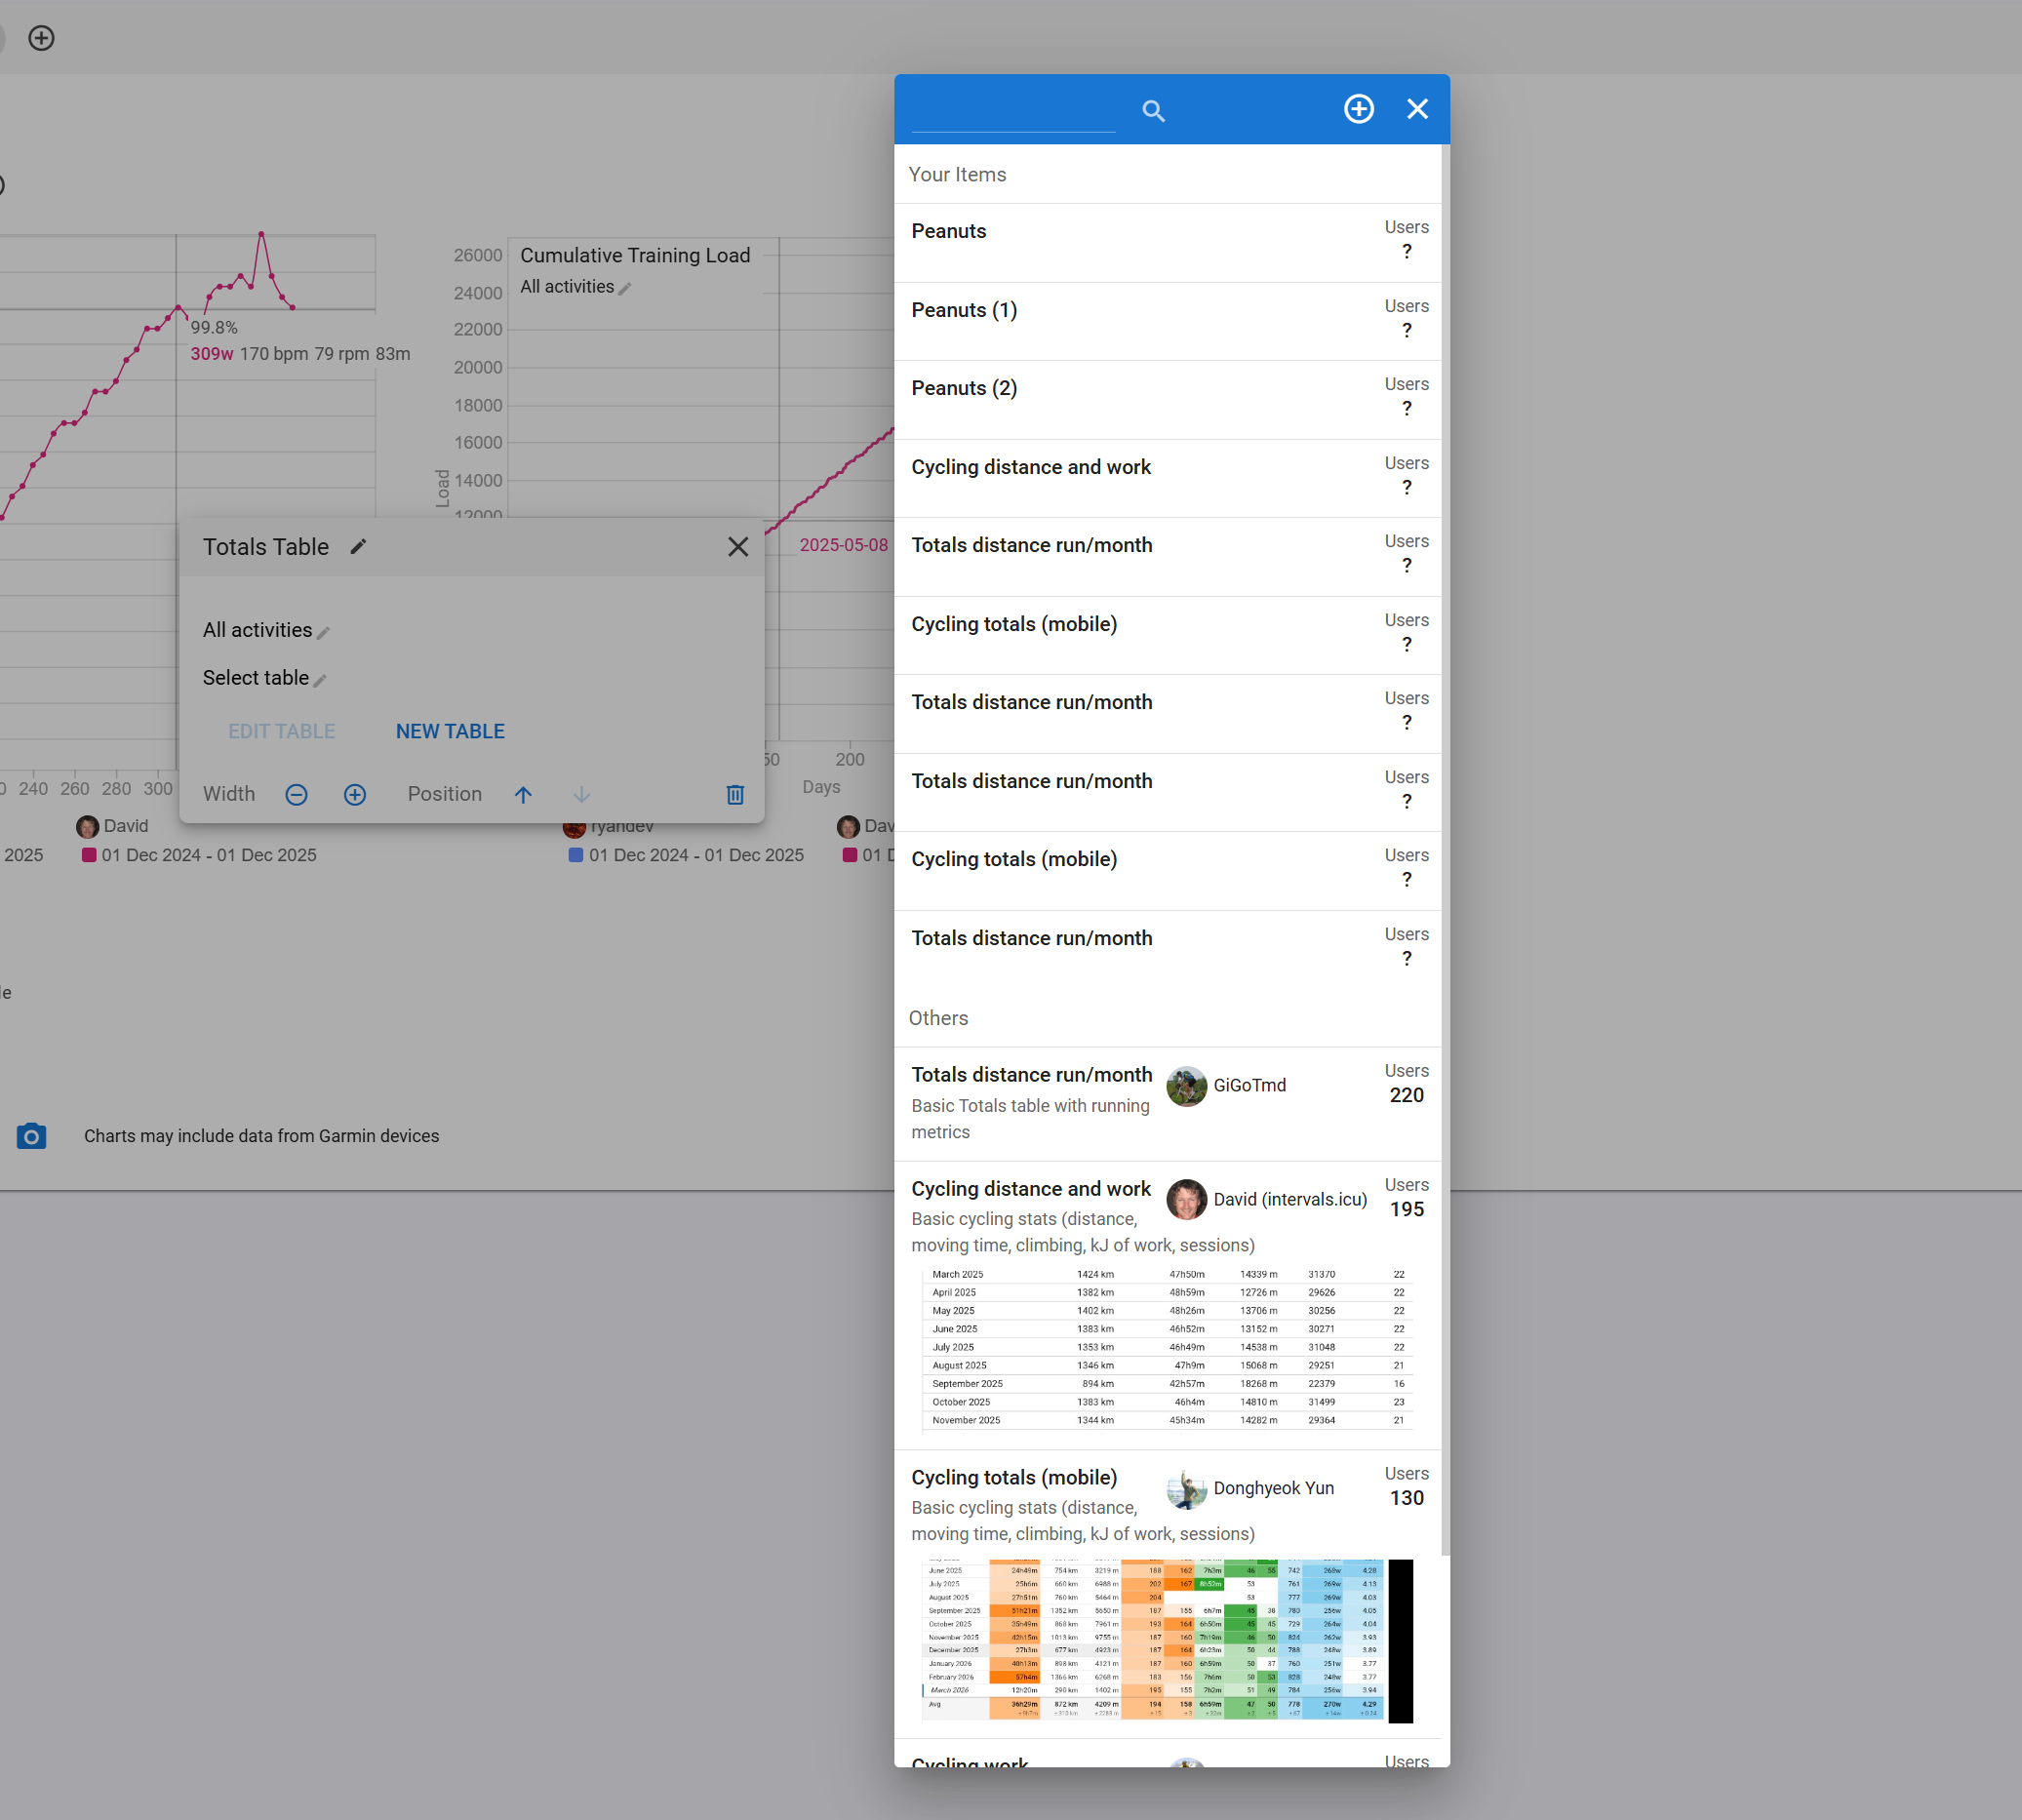
Select your own tables or publicly shared tables
Or create a brand new table
Please let us know what you all think and any issues you find, I will try my best to fix all the bugs and implement suggestions!
4 Likes
nice!
will look on how to keep things clean with a smaller table but it’s nice!
also, I like better the new activity filter per table and not per column! 
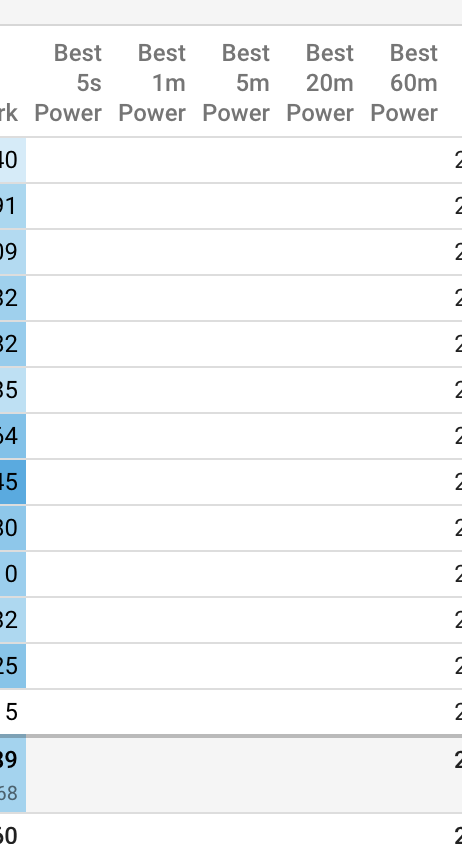
bug (?): best power for xx seconds isn’t available in compare page, works on other pages
request(?): is it possible to group by seasons and not years? and have the ability to have column with “Max …” group by season?
2 Likes
Can you make it possible to use the periods as colomns instead of separate charts?
For example I want to compare season2025 with season 2026 for running.
And it would be easier if I have a column for 2025 en 2026 in the same chart
1 Like
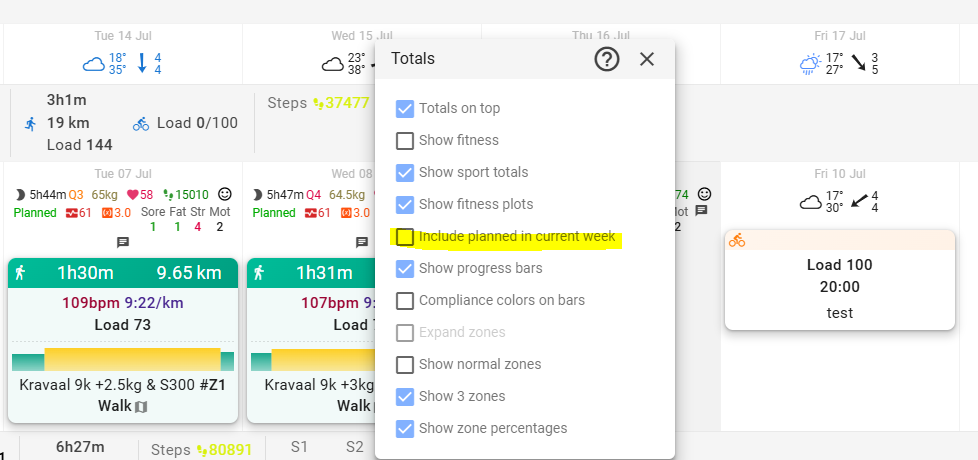
In my Totals Chart, the Weekly power load doesn’t match what is shown in the week summary on the calendar.
Do you have planned workouts? If you do and you have the setting on the calendar to include them in the week totals, you will end up with a difference that is the size of the future planned workouts. The Totals table does not include those.
Ah thank you for that. On closer inspection, however, my issue seems to be cause by a funky .fit file from a ride where my head unit crashed and then tried to restore and resume upon restart. I overrode the load in Intervals manually to reflect that of the whole workout and that change shows on the calendar, but doesn’t apply for the Table’s calculation. Good to know!