Hi David,
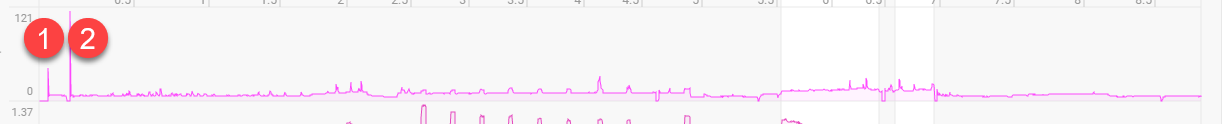
The Torque data seems to have no smoothing, and so it can be dominated by spikes when starting up:
Is there any way to clean up the data file, smooth it or whatever? I’d really like to see the torque data.
- Mark
Hi David,
The Torque data seems to have no smoothing, and so it can be dominated by spikes when starting up:
Is there any way to clean up the data file, smooth it or whatever? I’d really like to see the torque data.
More data:
Point 1 was when I started the bike from a dead stop at the start of the workout. Point 2 was restarting the bike after I hopped off to turn on the fan. Both are real data: instantaneous torque on startup can be really high. But it prevents me from seeing the rest of the data clearly, and that stuff is more interesting than the startup spikes. I’d be happy with manually scaling the y-axis, so the spikes can just blast off to infinity and beyond. Is there a way to do that?
Tx for the extra info. I need to find a way to deal with this automatically. That is likely less work than allowing manual axis edits.
Oh well…
i) second the original suggestion
II) Ten minutes ago looking at my data I was simply wondering if one could manually set y ranges of the graphs in the Fitness page – e.g., looking at a chart with per-workout TSS bars. Here, it would also be good to look at a 0–150 or 0–200 range instead of having everything look “the same” but a few special events at 400 or above…
Thus, the ability to set y ranges for every single plot would really be useful;-)
@david Hi, sorry for re-surrecting this thread. Though this problem persists. In my exprience, this is caused by data being present for torque, but not for cadence (or it being 1 or something).
Watts is usuually in a resonable range
I assume this could be fixed, by setting a min cadence (if a value for watt is present)
Check Torque > 20
If Cadence < (min CadenceValue) AND Watt > 50 (or minWattvalue)
on Yes = set Cadence to MinValue
on NO = do nothing…
In the cases I checked, cadence was 1,
Precisely the latest study by the team of Pallarés et al. establishes the importance of the torque start peak in a sprint workout.
I’m not seeing many issues as the torque y-axis appears to auto-scale…
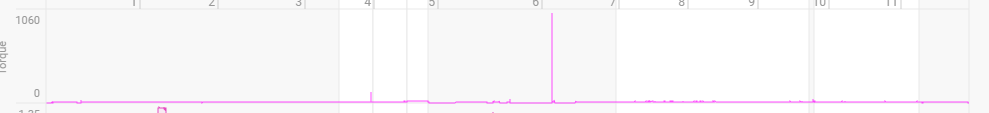
2+ hour ride, and just after the cursor is a 590+ peak torque
but torque scale maxes out at 213.
That was an easy endurance ride and torque mostly in upper teens and low twenties:
While I’d prefer more control over graphing, like in WKO:
Intervals did an ok job. Now if I zoom in:
the Intervals torque scale changes to a max of 592.
My preference is for easy one-click control over the y-axis scale. Would be great if I could click the y-axis and be able to specify min/max.