I have a chart with time in zones (watt). There is a “bars stack to 100%” option.
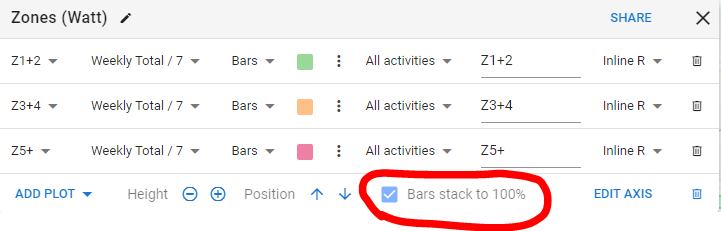
now i want to display some customfields (sleepzones in sec) but there i haven’t this option.

is it a bug or should it be a feature request?
I have a chart with time in zones (watt). There is a “bars stack to 100%” option.
now i want to display some customfields (sleepzones in sec) but there i haven’t this option.
is it a bug or should it be a feature request?
Hi is solved? I’m also trying custom charts with custom data fields and the 100% bar chart, and they’re not working. I’ve noticed that the data fields that usually work are time fields. But I’ve modified my data fields and I can’t get it to work. How do I do this? I want to create a custom chart with data from my own fields. Thanks.