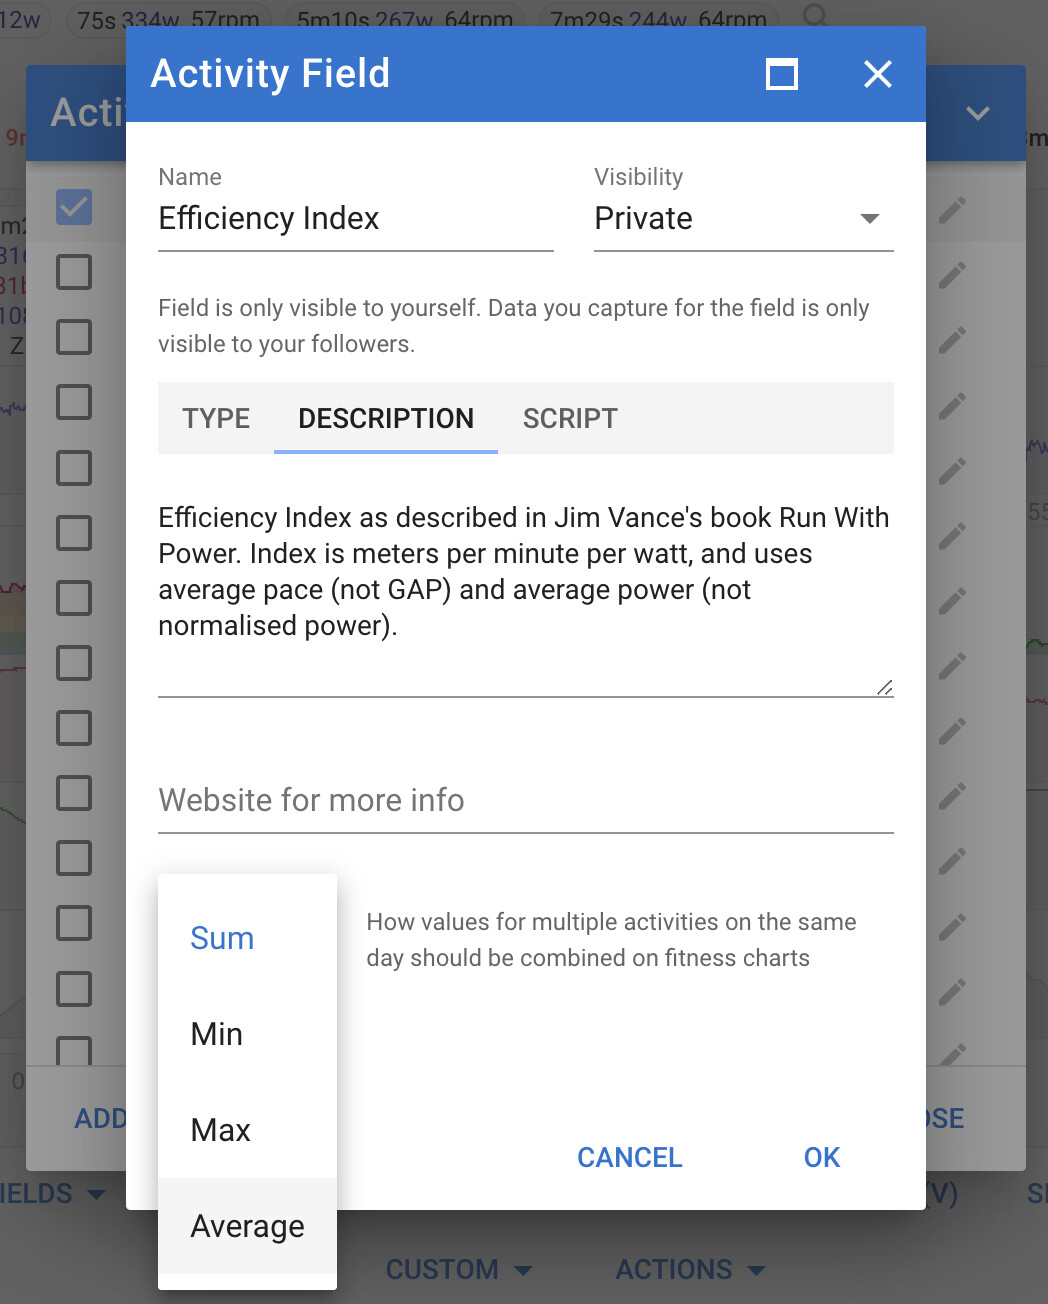
Hi,
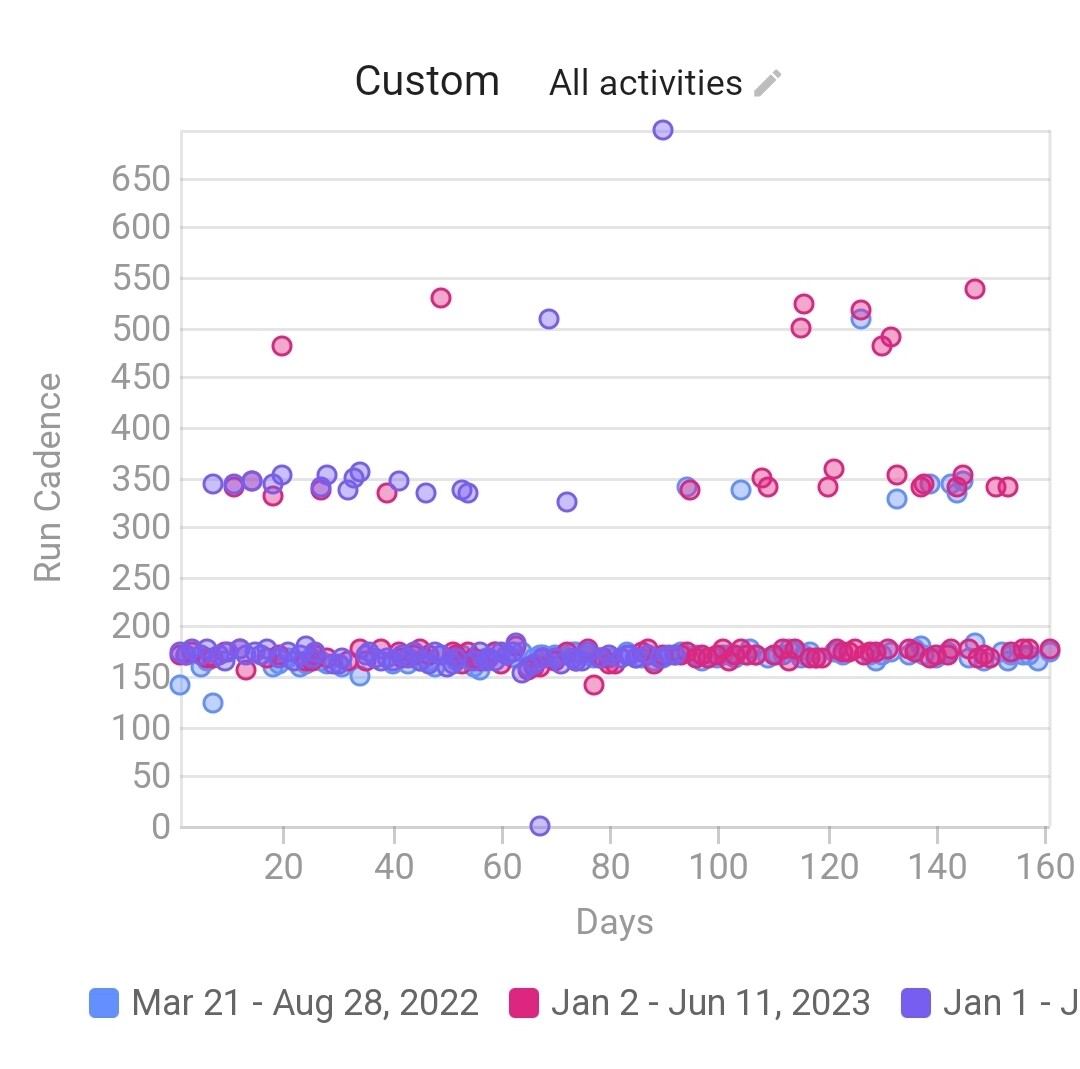
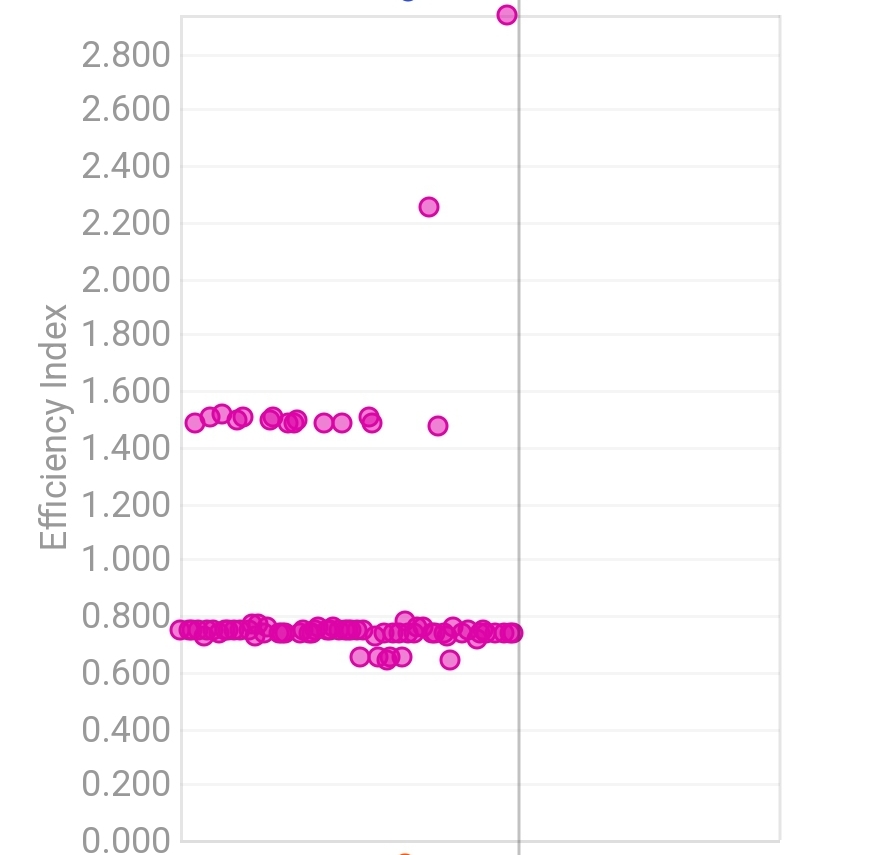
With both Run Cadence and/or with Efficiency Index they do not plot correctly if there is more than one activity in a calendar day. The graphing will be with days being on the x-axis.
The values stack for that day. So if you run twice in a day at a cadence of 180. Then on that day it will display 360 on the graph. If you run three times in one day it will display 540.
To resolve the problem the graph will need to take a weighted average of the runs for a day whenever there is more than one run.
Screenshots shown below