Hi,
How should I interpret the green-colored line on the graph?

Thank you in advance
Best,
Looks like your “planned workout”, with the actual over-layed in blue.
Look at the planned workout below your activity; it should have the same profile as the green line.
Thank you, Gerald.
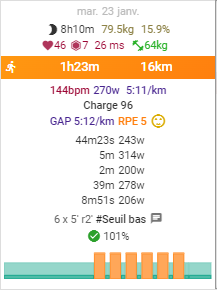
The plot doesn’t seem properly aligned. It’s true that I did a warm-up for 32 minutes instead of the planned 40 minutes.
After that, I did my drills and started my intervals at 44 or 45 minutes.
As a result, and visually, the green plot doesn’t provide relevant information when it should help verify if the session was executed correctly in terms of pace in accordance with the planned workout.
On the activity chart page at the bottom, click on options and use the ‘workout’ slider to align the workout with your activity.
@MedTechCD has responded, with the option to align the intervals with our plan (options), so you can see the detail.
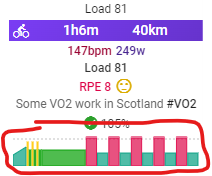
However, you can also look at your “compliance to plan” as a quick indicator.
In my example screenshot, it is 105%, with the white tick in a green dot, meaning I was 5% above the planned workout. When reviewing lots of athletes, that’s the first place I go to see if they complied, then drill down to see the detail.

Thank you both. I wasn’t aware of this option, and I will also refer to this indicator. intervals.icu is truly a very good platform compared to other.