Hi,
I noticed a bug in the calculation of moving averages, when there are multiple activities per day.
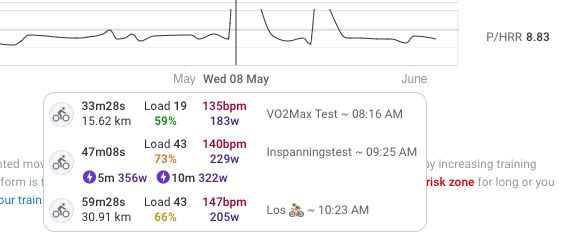
As you can see in the screenshot, I’m plotting a moving average of a ratio (power / heart rate reserve). The individual values of the 3 workouts are: 3.12, 2.61 and 3.11. The sum of these is 8.84, as you can see on the right of the screenshot.
But for the moving average, I would expect to take the average of those 3.
All my ‘normal’ values are in a range of ± 2-4. But now a value of 8.8 is included. Because of the nature of a moving average, this extreme value is carried along for a long time, making the graph useless.
There are however other cases where the sum would make sense. If you would plot a moving average of kiloJoules spend, you would want to include the sum of the workouts.