Hi,
The expected min and max values for the left and right axis on custom charts appear to be integers. In the context of pace, how can these values be adjusted ?
Thanks
Hi,
The expected min and max values for the left and right axis on custom charts appear to be integers. In the context of pace, how can these values be adjusted ?
Thanks
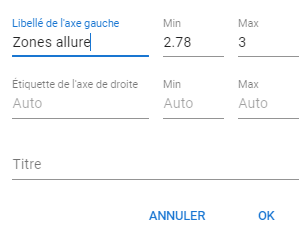
You need to enter the values as m/sec. Only speed in m/sec is supported at this moment.
10km/hr = 10000/3600 m/sec = 2.78 m/sec
I will test.
Thanks so much @MedTechCD
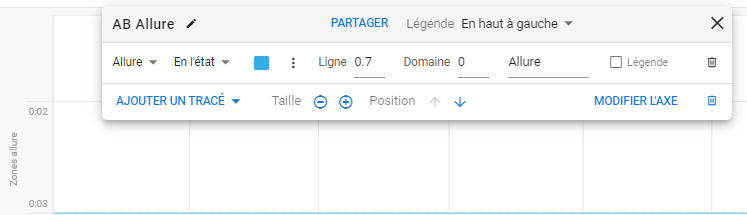
Ah, it is a plot with pace, so it follows pace and then you have to enter the limits in seconds.
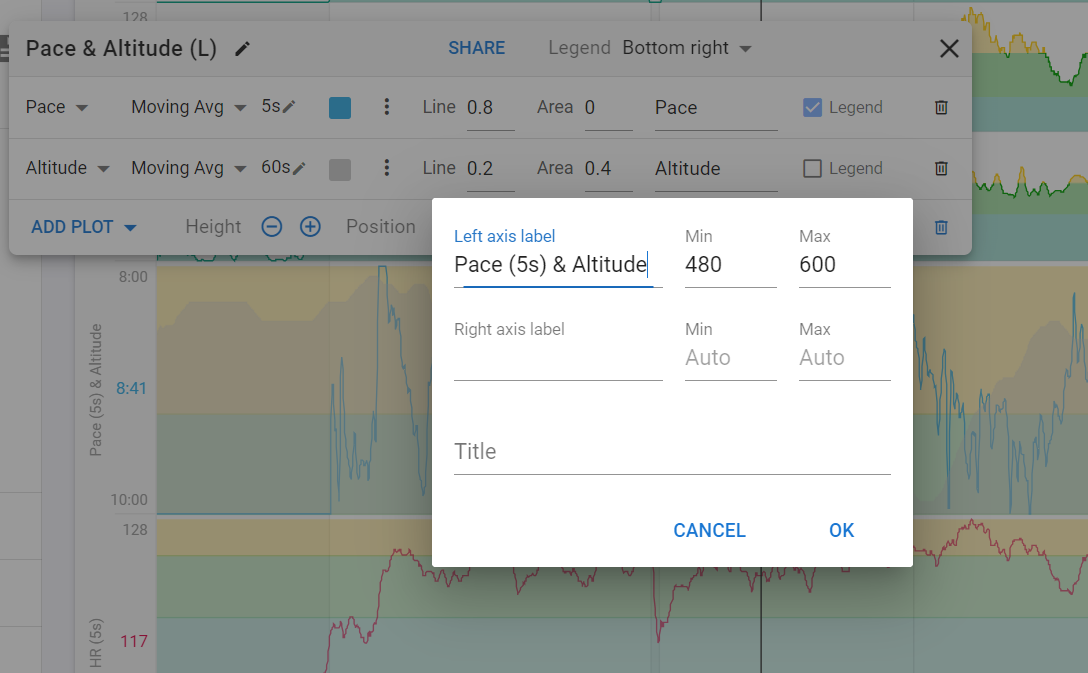
So in your case it should be max 360 and min 200.
I’m quite a bit slower then you are so I created an example with 10min to 8min pace. ![]()
Be careful with what you enter as max or min, if you switch them, the chart is mirrored upside down!
If you just want to avoid a compressed chart by eliminating slowdowns, only enter a max value and let the min on Auto.
It works very well ![]() . Thank you very much.
. Thank you very much. ![]()