Is there any metric for how smooth your power is during an activity? I’m not talking about if you do sprints and coast I mean for when you are at mostly a steady-state to see how variable your power is.
I’ve noticed when Im more worn out the variableness seems to increase a bit just from looking at it by eye on the chart but not sure how to get the data out in a way that I could better analyze.
I’m thinking this could be done by:
break ride up into nonoverlapping 30 second chunks (i.e. not every possible 30 seconds, just
calculate average power and normalized power for each of those chunks
The difference between average and normalized power would be the metric
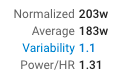
You can look at the “Variability” stat for the whole ride or an interval or portion of the ride. This is the normalised power / average power. If your riding is totally smooth (no spikes) it will be 1. Spikes are accentuated by the NP calculation.
To see it for intervals and portions of a ride click “Fields”:
I’m not sure that does what I want. Seems like it give a calculation for the whole section. I’m NOT talking about spikes like if you sprint or something like that. I want a way to show how much noise there is. For example, if you were expecting a straight line on an oscilloscope noise in the signal would make it rough looking.
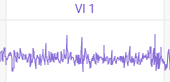
This shows a VI of one from an interval in erg mode on my trainer but is clearly not a straight line.
Maybe standard deviation of the power for an interval would be an easier way to compute a number to show this?
What would you achieve with this? I think it is a wast of time to focus your attention on that. Power always fluctuat, even in ERG mode on a trainer, but power smoothing will give a straight (fake) line. You have to look at the forest and do not focus to much on one tree
I cannot believe that this would give you any useful information. I believe that all power meters must do a lot of smoothing internally as the signal is very noisy, so what you would get is the result of the combination of the specific hardware and the smoothing algorithms used and not anything directly related to your pedalling. Of course there is an ANT+ Metric called pedal smoothness, but that’s measuring a different value - peak power to average power over a crank cycle.
I agree that this can’t really be compared between power meters as the design of different power meters will lead to different results but can be used to compare different rides from the same power meter.
I’ve noticed that when I’m feeling stronger my power output looks smoother and would like to be able to validate this. The point of this is to have an objective number to look at instead of just going by feel of what it looks like. Computing the standard deviation of the power numbers from an interval isn’t that complicated.
Did you check if cadence drops when becoming fatigued?
That alone would make the power curve less smooth.
I have a tendency of dropping cadence and pushing bigger gears when fatigued.