Until how many minutes, hours percentage of breaks in a activity it is still considered for the power graph?
By pausing the activity at stops, short breaks the average power output is much higher than if this time is considered as 0 power. I noticed that I had an 4 hours ride, after about 2 hours i took a 10-15 minutes break and then continoued for 2 hours. This break is not considered in the power graph and i looks as I was pedaling non stop.
On the other hand, longer group rides with even longer breaks (like for lunch) don’t show up in the power graph.
Is there a specific amount of time that is deciding that an activity is not considered? In my opionion every stop should coun’t as 0 power to the power graph, otherwise it is misleading.
Edit: I was searching the forum for quite some time and could not find any answers.
As fr me, I never pause my ride, preferring to let it count down/up.
But of late, I’m thinking if I should as these breaks w/o pausing seems to be racking up TSS.
I did a 9hr indoor ride (debugging my app of which only 12m was supposedly pedalling and ended up w/ a TSS of 72)
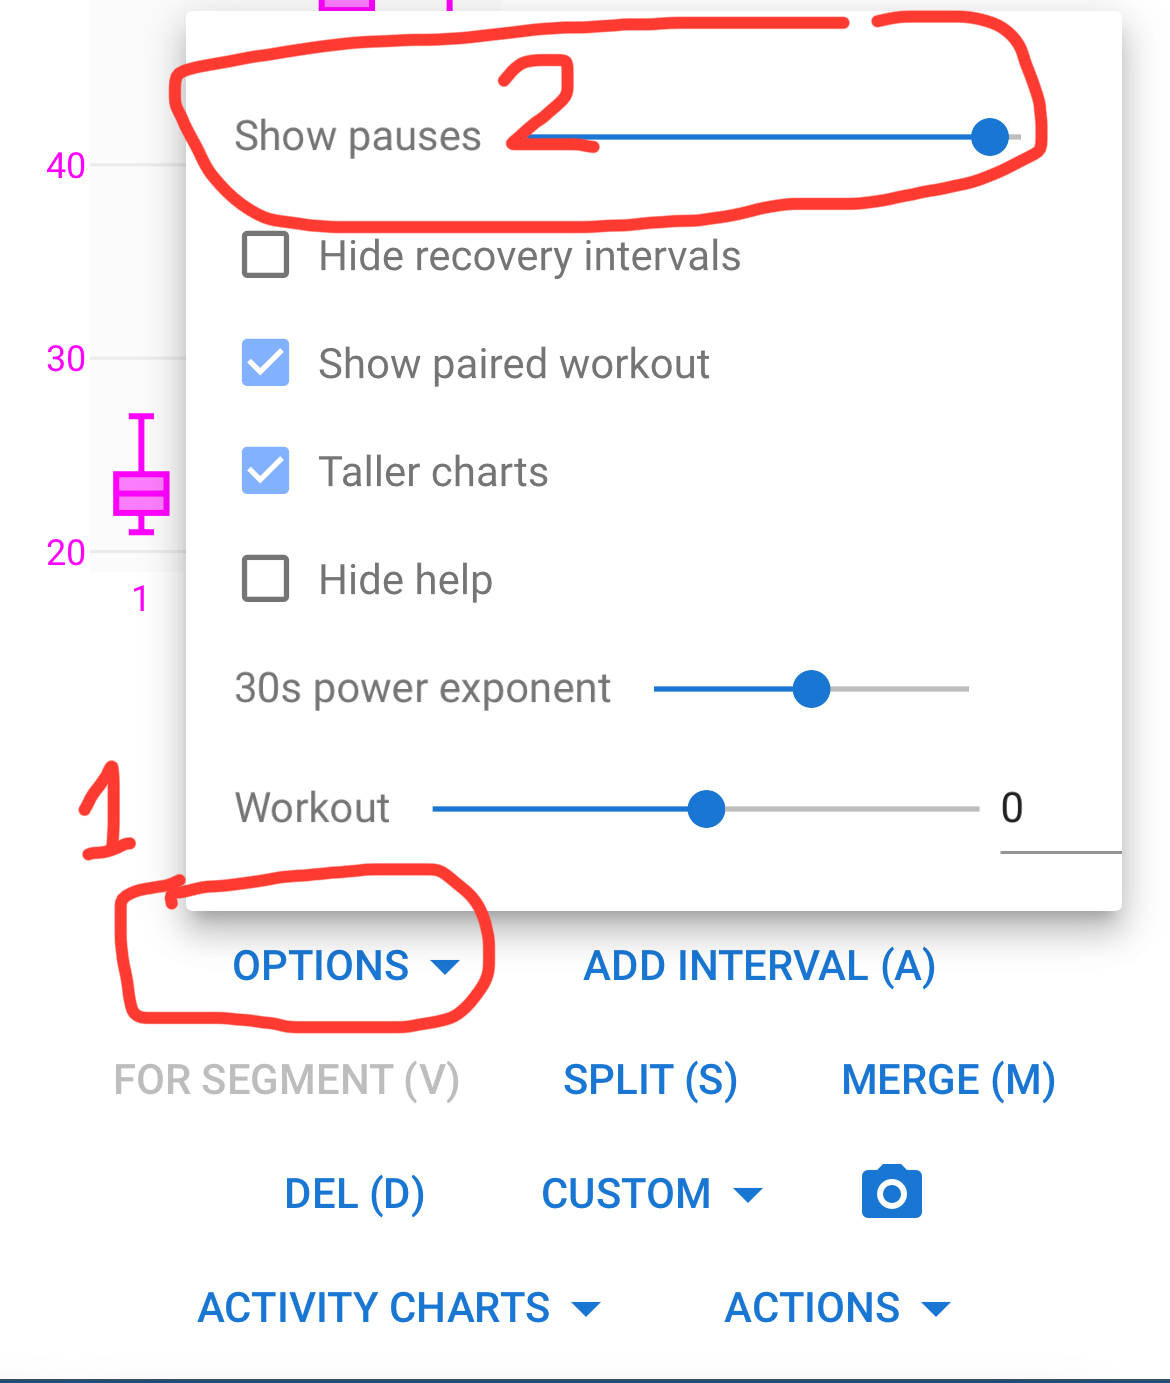
I was not aware of this option.
But this only let me see the pauses, it does not affect the average. Espacially not for the all time or season best power graph. Which is the main reason for my question, not sure if I was able to make this clear.
@app4g Thats an approach that would solve my problem, I think I will handle it this way for the future, but there are still some downsides like GPS jumping around while taking the bike computer inside and so on.
Average power includes zeros, so whether you are freewheeling or stationary, the average power is considered in the calculation, making it lower than actual.
HR will continue to record, and if you’re stopped, it will most likely end up with a lower average.
In my case I paused/stopped my ride with the Garmin Edge 530 button. The time of this specific pause was not considered in the average of the activity. Neither in Garmin (which I don’t really expect), nor in Intervals.icu.
At the point in the red circle i took my break. If the break would be considered in the average in the power graph, it should drop from ~240ish to 215. This was not the case, it got only reduced to 225, but this was caused by the following down hill section.
On the other hand, in activity where I paused for even longer, those way to high average compared to the real time does not show up in the power graph. And I think the averages were splitted and not considered with the overall moving time.
I only pause my device for longer breaks or when going inside where GPS data would be messed up. I never pause for shorter interruptions and have Auto-Pause on my device disabled.
Averages are calculated over ‘moving time’ including zeroes. Going downhill with 0 power will be included. Stopped time (as in your device stopped recording) will not include any data.
In the summary data at the top, you will get an average for the total ‘moving’ time. One hour at 150W + 2 hours break + 1 hour at 150W will give you an average of 150W.
On the Power graph you will have 150W at the 1 hour mark but nothing for any longer time-frame because nothing has been done for any longer time-frame. If you expect it to show 50W for 3 hours or 75W for 4 hours, then no, that’s not how it is implemented. The power graph only shows contiguous results.
I’m looking into this a bit deeper to…
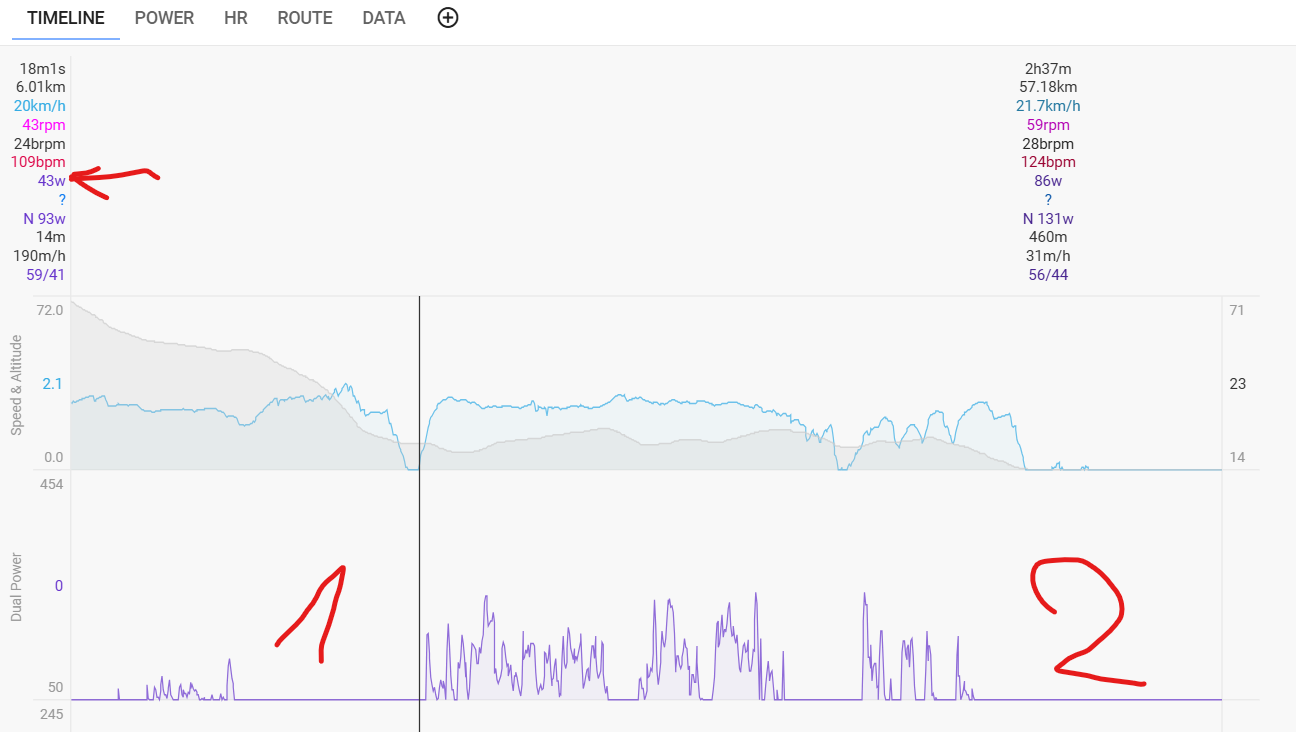
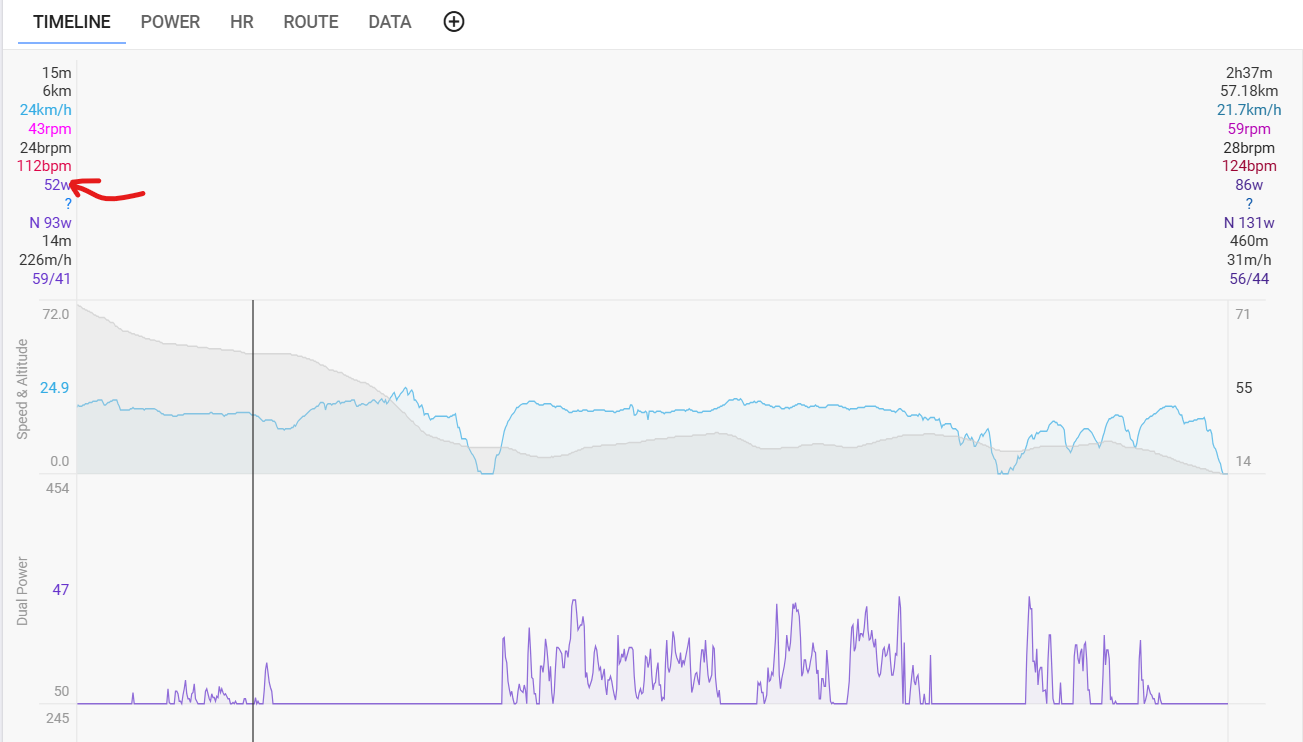
Here’s a selection with 2 zero power sections. First one is a descent, zero Power and non-zero Speed. Second one is a stop, zero Power and zero Speed.
The same section excluding the stopped part returns 52W average.
This leads me to the conclusion that short stopped time is indeed taken into account for averages.
Longer stopped times might have different behaviour, but I don’t know what the breakpoint might be.
Those are extremely long breaks
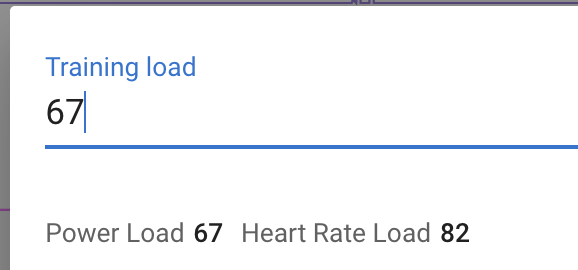
Could have to do with the different way of calculating NP. TSS is calculated from NP and there have already been multiple discussions regarding the differences in NP between TP, GC and Intervals.
What’s the NP for this reported by GC and Intervals.
i was on the bike on-off trainer for 9 hours doing debugging for BreakAway. Actual pedal suppossedly was 12m only (still debugging… even harder when i don’t have the actual trainer Model/ble protocol)
Intervals.icu does activity analysis using a “fixed_watts” stream which is the power stream with short drop outs (8s or less) fixed and power spikes removed.
The average power for the activity reported in the summary section at the top (226w) is Joules / recording time (if available) otherwise elapsed time.
Joules (3292103 J): The sum of the power stream interpolated to 1s per point
Recoding time (14593s): The elapsed time (15445s) for the activity with gaps (not recording e.g. paused) of more than 30s removed
So it is your average power when you were actually riding (226w = 3292103 / 14593).
The average power reported by the power curve for the activity is 214w for 4h15m. This is the Joules divided by the elapsed time i.e. it includes all stops. So if you are interested in the “true average power” then this is where to look.
The average power for each interval is the average of all the power points in the interval. So it excludes stops.
I was now also able to make sense of the data on my own. I think what got me thinking that the numbers were to high, was that the average of the 2nd half after the break was slightly higher than the first 2 hours including the break.
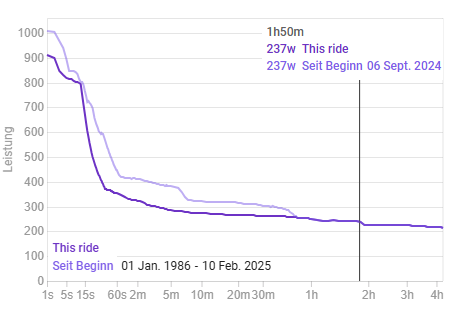
That means in the powergraph the first 1 hour 50 minutes is the average from the start, then the 1h 55 and 2h 00 are from the 2 hours riding after the break. Considerig this fact I can know make sense for the entire power plot, and its indeed not to high as I suspectetd in my initial post.
The numbers from my activity were probably a bit unfortunate in combination with my misinterpretation