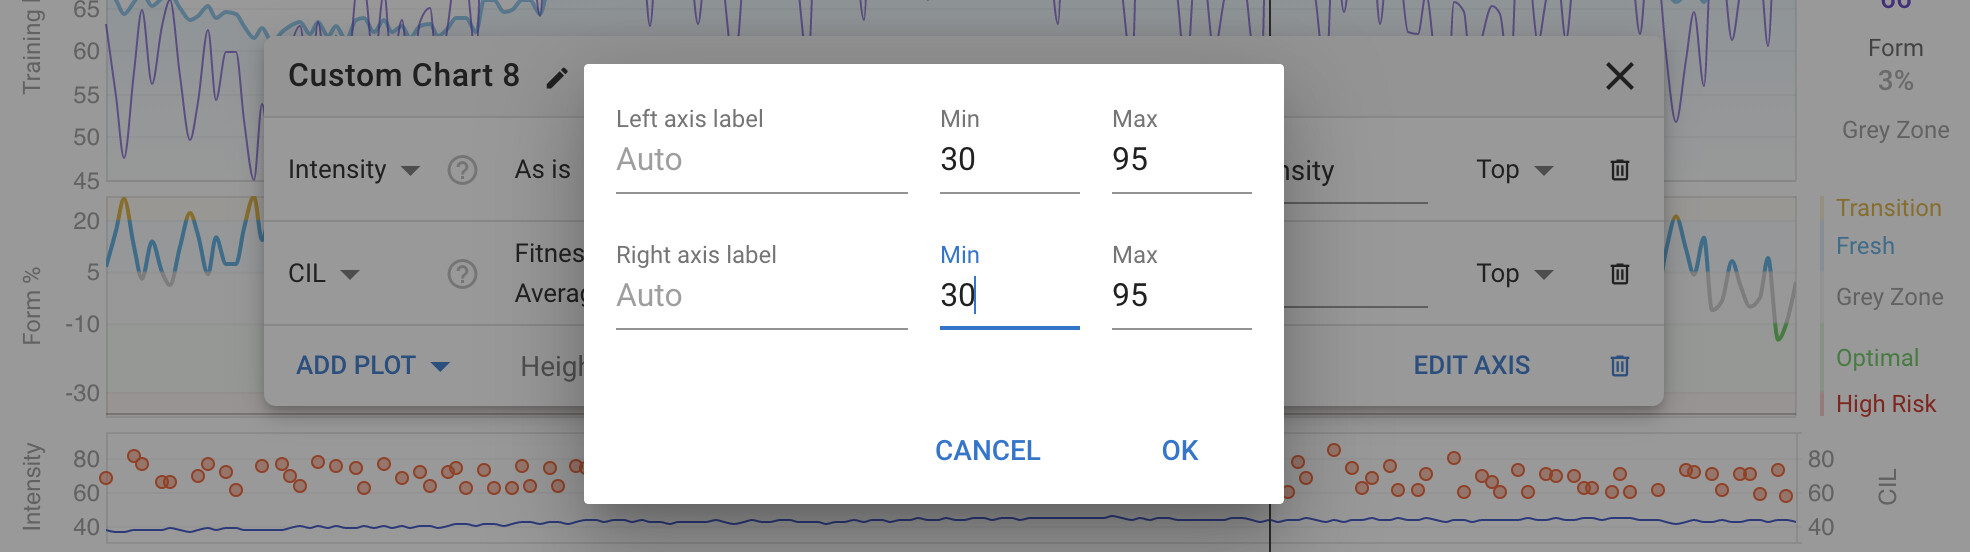
You can now set your own min and max values for the left and right axis on custom charts. Click the “Edit Axis” button:
9 Likes
Hi @david, this is cool, thank you!
Now, something related I should have realized/brought up earlier is the wish for manual assignment of values to axes… I.e., I’ve a plot with weekly load and CIL, where the latter is essentially, and obviously, a flat line pretty much at the bottom, because they are both plotted with the Load values on the left axis. This does make sense as a default, but being able to plot CIL on a separate ‘load’ axis would be more useful;-)
Awesome, but it doesn’t seem to respect the values I enter into min and max yet.
Hi! This is great! Thank you! I would like to have the possibility to input a separate horizontal line as a marker for many reason. Like, do not go over this or under that value. It would really help while analyzing values the value is above a predefined target 
2 Likes
@MattClarke Do you currently have a chart configured with min/max that isn’t working? If so could you please tell me which one it is and I can have a look. Tx.
@Benjamin_Hendler I have added that to do the todo list.
2 Likes
@david Check out the cadence chart on one of my activities. Min should be 50 and Max should be 110. Thanks.
Aha. I only implemented it for the fitness custom charts. I forgot that the axis dialog is also used for the activity timeline custom charts. Anyway I have just added support there so it should work now.
1 Like
Thanks, David!
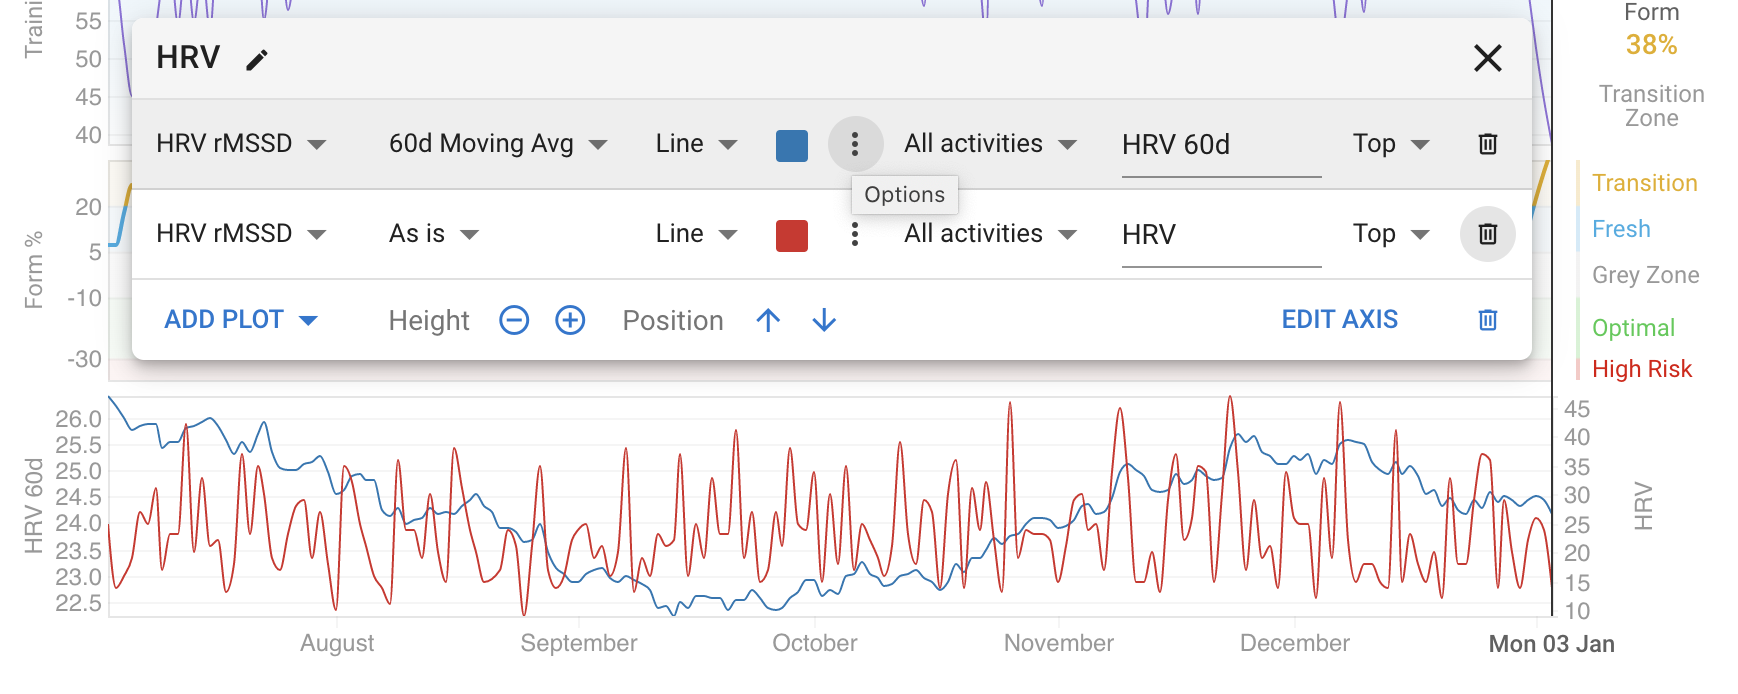
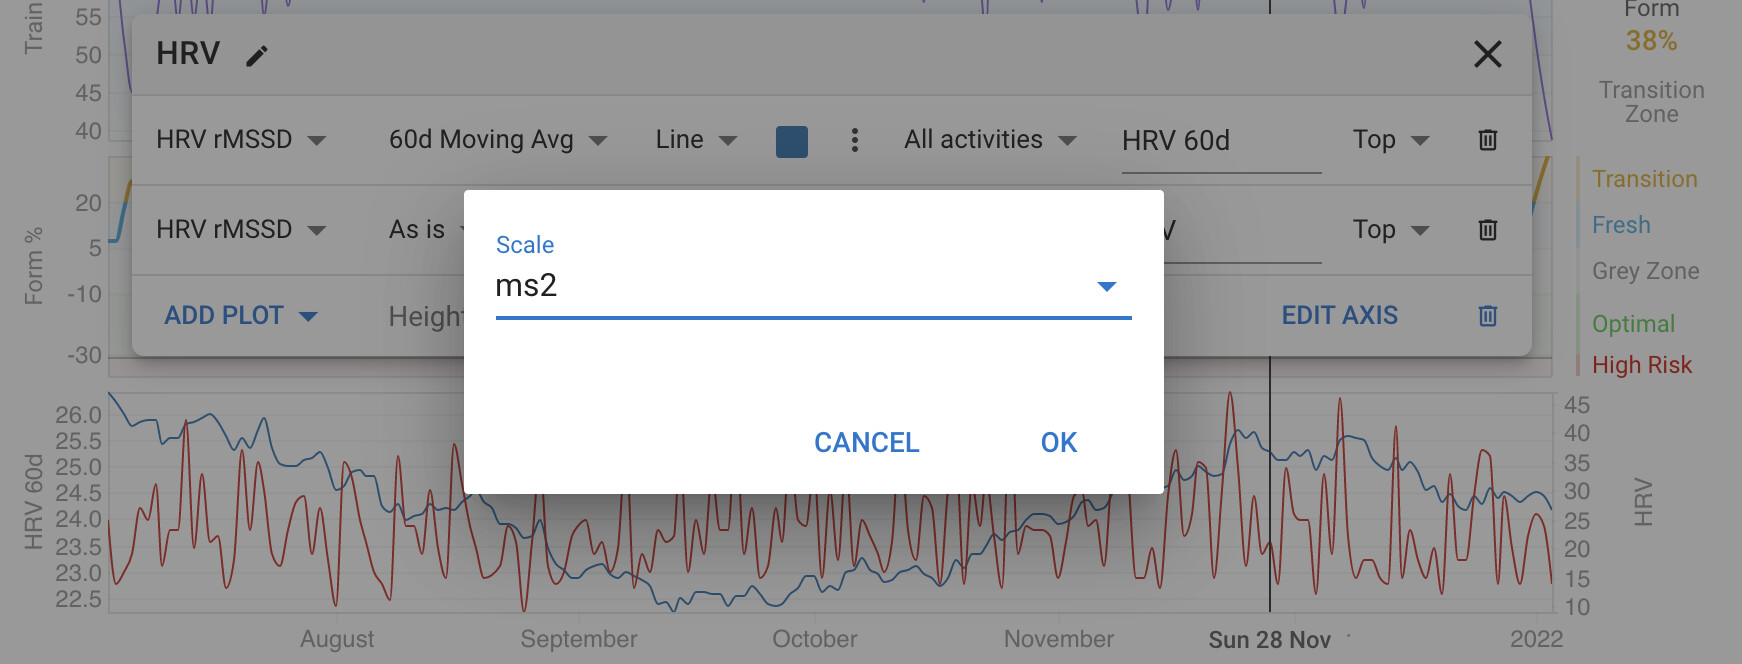
I have just implemented this. You can now choose the scale for each plot using the new dot dot dot menu:
2 Likes
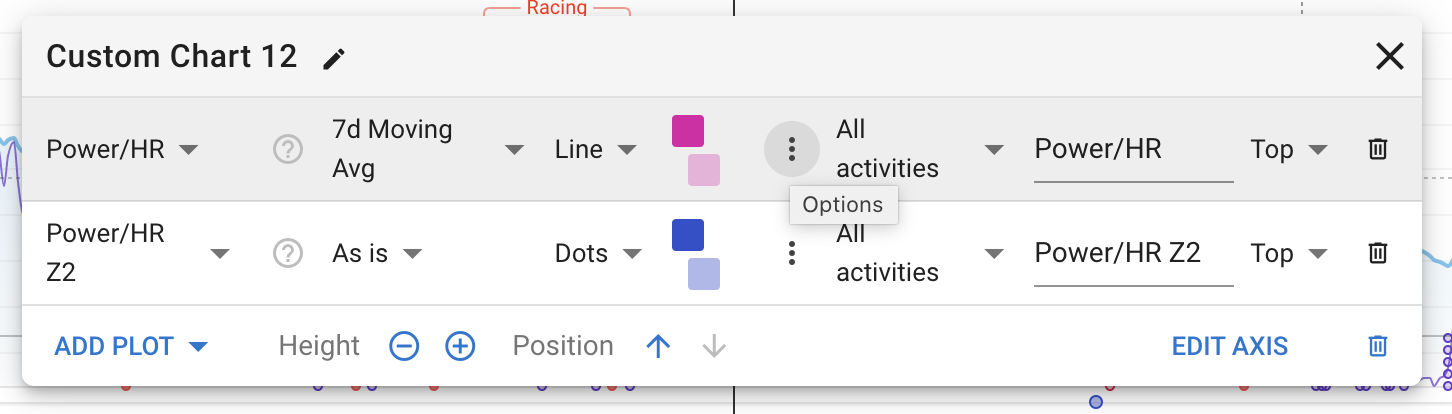
It’s not clear what happens with axis min/max if you have a third plot. Presumably it’s always automatic? I see that you can choose the scale with this new feature described in this thread (which is great). It would still be nice to be able to control max value on the “invisible” third scale.
Thats a good idea. I will see what I can do. I want to do some more work on this soon to support custom colour bands and so on.
1 Like

Not yet  But I have been thinking about how to do it …
1 Like
There is now. I will do a full announcement on Sat … but you can get a sneak peak. Click the dot dot dot …
1 Like
I’ve created a custom chart on the Fitness page to show Garmin calculate LTHR and LTP but can’t work out how I make one of these use the second y-axis. Is there any way to force this to be the case?
Unfortunately that isn’t supported on custom fitness charts yet, only on custom activity charts.
1 Like
what’s the format for setting min-max pace times in the axis? (min/km)
by trial en error I now have some limits but that’s with a decimal number.
For pace it should be seconds/km.
For speed meters/second.