You can plot the graph associated with calorie expenditure in the fitness tab.
I plot in grey the calories days after days, and curves are moving averages on several periods (1 years, 3 weeks, 7 days)
@david in the top post you mention writing fields.
does that mean I can have one custom field called LOGIC that does everything and all other custom fields are “dumb” fields, that get written by the logic javascript?
because that doesn’t seem to work for me.
I created the field LOGIC, the field Demo1 and the field Demo2 and the following code does nothing:
{
    activity.Demo1 = 'activity test'
    icu.activity.Demo2 = 'icu.activity test'
}
That will work now. I just fixed a bug that was breaking updates of custom fields like that from scripts on activities. My “Logic” field looks like this (Demo1 is text, Demo2 is numeric):
{
  activity.Demo1 = 'foo'
  activity.Demo2 = 123.45
  'bar'
}
Is there a possibility to get access to the 30s-avg-power stream?
Do you mean the exponentially scaled one or just a 30s moving average?
I have added a new stats object and will deploy Monday AM (GMT+2). So now you can do this sort of thing to compute a 30 second power stream:
{
  let watts = icu.streams.fixed_watts
  let w30 = icu.stats.calcMovingAvg(watts, 30)
  for (let i = 0; i < data.length; i++) data[i] = Math.floor(w30[i] + 0.5)
}
Note that the second argument is the number of points to use for the window, not seconds. If you want to cater for activities with data points more than 1 second apart:
let w30 = icu.stats.calcMovingAvg(watts, 30 / (activity.icu_median_time_delta || 1))
// activity.icu_median_time_delta is the median time between data ticks
There is also calcCenteredMovingAvg which is what is usually used in the Intervals.icu web app.
Nulls and undefined values are treated as zero for both average calcs.
Great, I will try that.
Is it possible to access the gradient without smoothing? I am analysing a series of starts where you have to do them in a specific percentage but I see that it is not the correct one according to the gps and it is because of the smoothing.

Intervals.icu generates “grade_smooth” from the fixed_altitude, latlng and time data. The distance between points over a 50m window and altitude change are used to compute gradient. The data is noisy even with a 50m window.
You could use the same streams to compute gradient on a point by point basis (no window) but it will be very noisy.
Thanks David
Hi folks,
I’m trying to compute device battery consumption through the course of a long activity.
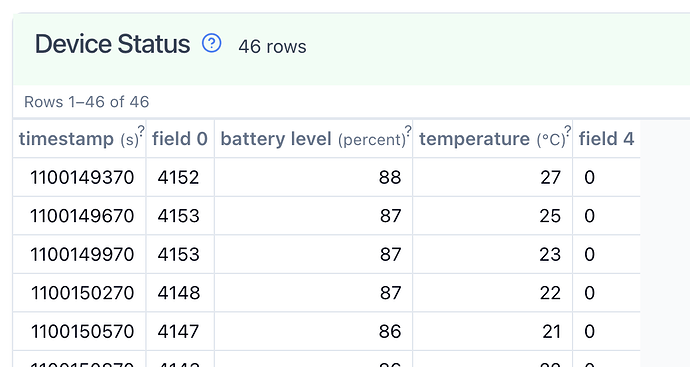
In exploring the fit file on https://www.fitfileviewer.com/ I find the field I want buried deep within a “Device Status” block of messages:
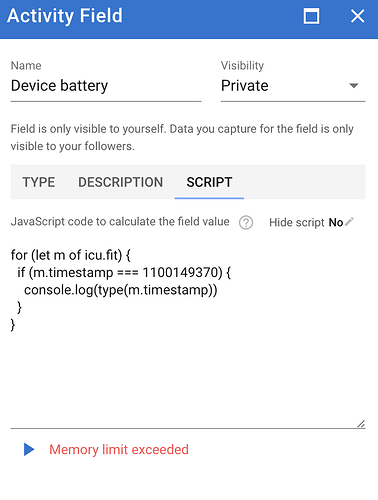
I am struggling to find this field in the icu.fit block, even iterating over all the messages in that to find those with a timestamp that match (it fails due to memory issues):
Could you please give me some guidance?
Try to iterate just the device info section
for (let di of icu.fit.device_info)
{
    console.log(di)
}
Thanks, its a good suggestion: and this iterates over a different section of the FIT file (titled Device Info in https://www.fitfileviewer.com/)
By extension, I’ve tried to iterate over icu.fit.device_status, but that doesn’t exist.
Ah, didn’t see the “status”. Don’t know, if there is an object to read it directly.
But maybe you can try this:
{
  const fitmsg = icu.fit;
  for (let ds of fitmsg)
  {
    if(ds.timestamp?.value === 1100149370)
        console.log(ds)
  }
}
Thanks!
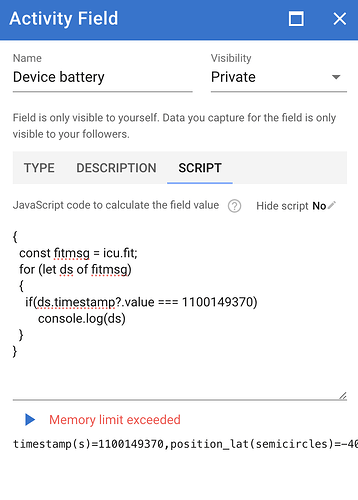
I get a memory limit exceeded error when running that code:
Here it only returns one record (from the Record section of the fit file); presumably erroring out before getting to the device status portion.
I did some poking around. Unfortunately when fitfileviewer.com displays undocumented messages (e.g. “Device Status”) and fields that it has a name for somehow, it doesn’t include the message or field number. This makes it tricky to work with them in Intervals.icu.
I used code like this to find the “Device Status” messages:
for (let ds of icu.fit.unknown) {
    console.log(ds._num + " " + ds)
}
104 unknown#253=1100096442,unknown#4=0,unknown#0=3966,unknown#2=17,unknown#3=31
This matches:
So the message number is 104 and the battery level percent field number is 2. Now you can do:
for (let ds of icu.fit.m_104) {
    let percent = ds.f_2?.value
    console.log("battery% " + percent  + " from " + ds)
}
Thanks for the reply (and your awesome site)
I have solved it, and sharing my code for review and comment:
{
let messages = icu.fit.unknown
  .filter(element => ((element._numFields===5) && (element[1].value===0)))
  .map(element => (element[3].value));

(messages[0] - messages[messages.length - 1]) / (activity.elapsed_time / (60*60))
}
I noticed in fitfileviewer that the device status messages always had 5 fields and one entry was always 0. So I used a filter.map pattern to select those messages from unknown. I then find the battery consumption as the first battery entry minus the last one; dividing that by the activity duration gives me battery consumption (%/hour).
Question: How can I export all the battery values to display as a curve alongside, for example, temperature on a graph?
For that you need to make a custom activity stream.
Using your example created Stryd Foopod Calibration Factor custom field, thanks.
{
  let activesensor = ''/*Active Sensor */
  for (let di of icu.fit.device_info) {
    if (

        di.source_type?.value === 1 /* Ant+ */ &&
        (di.device_type?.value === 124 /* Stride Speed an Distance */ )
    ) {
           activesensor = di.f_24?.value
    }

  let cf = ''
  for (let se of icu.fit.m_147) {
    if ( se.f_0?.value === activesensor
   &&
        ( se.f_52?.value === 2)) {
         cf = se.f_11?.value/1000
    }
  }
  cf
}  }
Hi David, I am struggling with this script. Once worked but now doesn’t.
Many thanks.
{
  let activesensor = ''/*Active Sensor */
  for (let di of icu.fit.device_info) {
    if (

        di.source_type?.value === 1 /* Ant+ */ &&
        (di.device_type?.value === 123 /* bike_speed */)
    ) {
           activesensor = di.f_24?.value
    }

 let ws = ''
 for (let se of icu.fit.m_147) {
    if ( se.f_0?.value === activesensor
    &&
        ( se.f_52?.value === 4)){
         ws = se.f_10?.value
    }
  }
 ws
}  }


