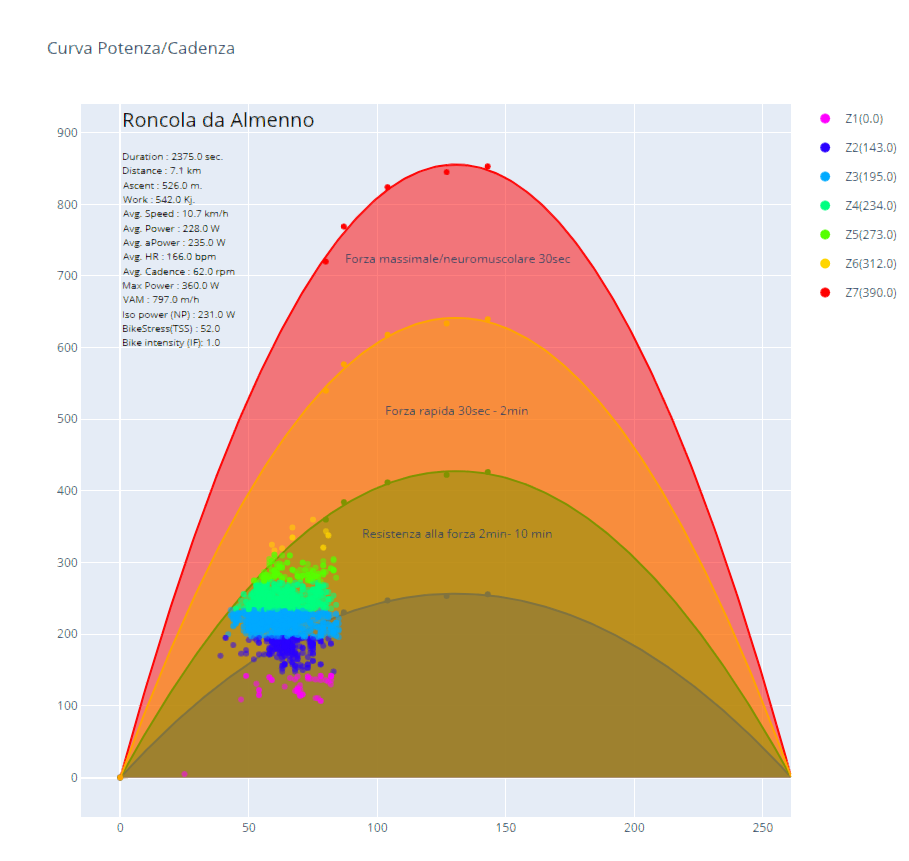
I created a related graph called power/cadence in python , to be used in Golden cheetah. Wouldn’t there be someone willing to “convert” to javascript?
Basically you run an initial test with this protocol ( http://coachmichelusi.blogspot.com/2012/01/test- Potenza-cadenza.html) and insert the data into the script in this section
#INSERT HERE A POWER VALUES OF THE TEST
P0=0
P1=720
P2=769
P3=824
P4=845
P5=853
P6=0
#INSERT HERE THE CADENCE VALUES OF THE TEST
C0=0
C1=80
C2=87
C3=104
C4=127
C5=143
At the end, by selecting all the various segments, the power distributions based on the force appear in the graph
This is a simple chart
and this is a script
##
## Python program will run on selection.
##
import pandas as pd
import numpy as np
import plotly
import plotly.graph_objs as go
from plotly.graph_objs import Scatter, Layout, Figure, Heatmap
import tempfile
import pathlib

# Define tempory file
temp_file = tempfile.NamedTemporaryFile(mode="w+t", prefix="GC_", suffix=".html", delete=False)

xx = np.asarray(GC.series(GC.SERIES_WATTS),dtype=object)
yy = np.asarray(GC.series(GC.SERIES_CAD))
secs = np.asarray(GC.series(GC.SERIES_SECS))
laps = GC.activityIntervals()
df = pd.DataFrame(GC.athleteZones())
activity_metric = GC.activityMetrics()
zone = GC.athleteZones(date=activity_metric["date"], sport="Bike")


# Identify for every interval the zone color
breaks = zone["zoneslow"][0]
zone_colors = zone["zonescolor"][0]

# Add legend labels
legend = []
zone_index = 1
for zone in breaks:
    legend.append("Z" + str(zone_index) + "(" + str(zone) + ")")
    zone_index += 1

# cond is a boolean array to mark samples in selected intervals
cond = (secs < 0)
for i in range(len(laps["selected"])):
    if laps["selected"][i]:
       cond |= (secs >= laps["start"][i]) & (secs < laps["stop"][i])

xx=xx[cond]
yy=yy[cond]

#FIND VALUE FOR CHART DESCRIPTIONS
sel = list(laps["selected"])
index=sel.index(True)

#print(GC.activityIntervals().keys())

#INSERT HERE A POWER VALUES OF THE TEST
P0=0
P1=720
P2=769
P3=824
P4=845
P5=853
P6=0

#INSERT HERE THE CADENCE VALUES OF THE TEST
C0=0
C1=80
C2=87
C3=104
C4=127
C5=143


#POWER VALUE RESISTENZA ALLA FORZA
P0_30=P0*0.3
P1_30=P1*0.3
P2_30=P2*0.3
P3_30=P3*0.3
P4_30=P4*0.3
P5_30=P5*0.3


#POWER VALUE FORZA RAPIDA
P0_50=P0*0.5
P1_50=P1*0.5
P2_50=P2*0.5
P3_50=P3*0.5
P4_50=P4*0.5
P5_50=P5*0.5


#POWER VALUE FORZA MASSIMALE/NEUROMUSCOLARE
P0_75=P0*0.75
P1_75=P1*0.75
P2_75=P2*0.75
P3_75=P3*0.75
P4_75=P4*0.75
P5_75=P5*0.75


points = np.asarray([(C0,P0),(C1,P1),(C2,P2),(C3,P3),(C4,P4),(C5,P5)])
points30 = np.asarray([(C0,P0_30),(C1,P1_30),(C2,P2_30),(C3,P3_30),(C4,P4_30),(C5,P5_30)])
points50 = np.asarray([(C0,P0_50),(C1,P1_50),(C2,P2_50),(C3,P3_50),(C4,P4_50),(C5,P5_50)])
points75 = np.asarray([(C0,P0_75),(C1,P1_75),(C2,P2_75),(C3,P3_75),(C4,P4_75),(C5,P5_75)])

# get x and y vectors
x = points[:,0]
y = points[:,1]

x30 = points30[:,0]
y30 = points30[:,1]

x50 = points50[:,0]
y50 = points50[:,1]

x75 = points75[:,0]
y75 = points75[:,1]

# calculate polynomial of test power
z = np.polyfit(x, y, 2)
f = np.poly1d(z)

# calculate polynomial of 30% test power
z30 = np.polyfit(x30, y30, 2)
f30 = np.poly1d(z30)

# calculate polynomial of 50% test power
z50 = np.polyfit(x50, y50, 2)
f50 = np.poly1d(z50)

# calculate polynomial of 75% test power
z75 = np.polyfit(x75, y75, 2)
f75 = np.poly1d(z75)


#polynomial line of a test power/cadence
datatest=[]
cadence=range(0,300)
for n in cadence:
    c = np.asarray((z[0])*(n*n))+((z[1])*n)
    datatest.append(c)
datatest = np.asarray(datatest)
datatest= datatest[datatest >= 0]

#polynomial line of a 30% test power/cadence
data30=[]
cadence=range(0,300)
for n in cadence:
    c30 = ((z30[0])*(n*n))+((z30[1])*n)
    data30.append(c30)
data30 = np.asarray(data30)
data30= data30[data30 >= 0]

#polynomial line of a 50% test power/cadence
data50=[]
cadence=range(0,300)
for n in cadence:
    c50 = ((z50[0])*(n*n))+((z50[1])*n)
    data50.append(c50)
data50 = np.asarray(data50)
data50= data50[data50 >= 0]

#polynomial line of a 75% test power/cadence
data75=[]
cadence=range(0,300)
for n in cadence:
    c75 = ((z75[0])*(n*n))+((z75[1])*n)
    data75.append(c75)
data75 = np.asarray(data75)
data75= data75[data75 >= 0]


#Estrapolate zone color form dataframe
col1=df.iloc[-1]['zonescolor'][0]
col2=df.iloc[-1]['zonescolor'][1]
col3=df.iloc[-1]['zonescolor'][2]
col4=df.iloc[-1]['zonescolor'][3]
col5=df.iloc[-1]['zonescolor'][4]
col6=df.iloc[-1]['zonescolor'][5]
col7=df.iloc[-1]['zonescolor'][6]
zcol=[col1,col2,col3,col4,col5,col6,col7]

#Estrapolate zone power form dataframe
pow1=df.iloc[-1]['zoneslow'][0]
pow2=df.iloc[-1]['zoneslow'][1]
pow3=df.iloc[-1]['zoneslow'][2]
pow4=df.iloc[-1]['zoneslow'][3]
pow5=df.iloc[-1]['zoneslow'][4]
pow6=df.iloc[-1]['zoneslow'][5]
pow7=df.iloc[-1]['zoneslow'][6]


#define list color
color=[]
for i in range(len(xx)):
    if xx[i] >= pow1 and xx[i] <= pow2:
        color.append(col1)
    elif xx[i] > pow2 and xx[i] <= pow3:
        color.append(col2)
    elif xx[i] > pow3 and xx[i] <= pow4:
        color.append(col3)
    elif xx[i] > pow4 and xx[i] <= pow5:
        color.append(col4)
    elif xx[i] > pow5 and xx[i] <= pow6:
        color.append(col5)
    elif xx[i] > pow6 and xx[i] <= pow7:
        color.append(col6)
    elif xx[i] > pow7:
        color.append(col7)


#polynomial plot of test power
trace1 = go.Scatter(
                  y=datatest,
                  mode='lines',
                  marker=dict(color='red'),
                  name='TEST POWER',
	        showlegend=False,
	        fill='tozeroy'
	        )
#power test plot
trace2 = go.Scatter(
                  x=x,
                  y=y,
                  mode='markers',
                  marker=dict(color='red'),
                  name='TEST POWER',
	        showlegend=False,
                  )

#polynomial plot of 30% test power
trace3 = go.Scatter(
                  y=data30,
                  mode='lines',
                  marker=dict(color='blue'),
                  name='RESISTENZA ALLA FORZA',
	        showlegend=False,
	        fill='tozeroy'
	        )
#power test 30% plot
trace4 = go.Scatter(
                  x=x30,
                  y=y30,
                  mode='markers',
                  marker=dict(color='blue'),
                  name='RESISTENZA ALLA FORZA',
	        showlegend=False,
                  )

#polynomial plot of 50% test power
trace5 = go.Scatter(
                  y=data50,
                  mode='lines',
                  marker=dict(color='green'),
                  name='FORZA RAPIDA',
	        showlegend=False,
	        fill='tozeroy'
	        )
#power test 50% plot
trace6 = go.Scatter(
                  x=x50,
                  y=y50,
                  mode='markers',
                  marker=dict(color='green'),
                  name='FORZA RAPIDA',
	        showlegend=False,
                  )

#polynomial plot of 75% test power
trace7 = go.Scatter(
                  y=data75,
                  mode='lines',
                  marker=dict(color='orange'),
                  name='FORZA MASSIMALE/NEUROMUSCOLARE',
	        showlegend=False,
	        fill='tozeroy'
	        )
#power test 75% plot
trace8 = go.Scatter(
                  x=x75,
                  y=y75,
                  mode='markers',
                  marker=dict(color='orange'),
                  name='FORZA MASSIMALE/NEUROMUSCOLARE',
	        showlegend=False,
                  )
#plot power activity
trace9 = go.Scatter(
                  x=yy,
                  y=xx,
                  mode='markers',
                  marker=dict(color=color,opacity=0.55),
	        name='ACTIVITY POWER',
	        showlegend=False,
                  )

layout = go.Layout(
                title='Curva Potenza/Cadenza',
                showlegend=False,
	      annotations=[
		dict(
        		    x=C5*0.92,
          	    y=P5*0.85,
         		    xref='x',
       		    yref='y',
       		    text='Forza massimale/neuromuscolare 30sec',
         		    showarrow=False,
         		    arrowhead=7,
		    ),
		dict(
        		    x=C5*0.92,
          	    y=P5*0.6,
         		    xref='x',
       		    yref='y',
       		    text='Forza rapida 30sec - 2min ',
         		    showarrow=False,
         		    arrowhead=7,
		    ),
		dict(
        		    x=C5*0.92,
          	    y=P5*0.4,
         		    xref='x',
       		    yref='y',
       		    text='Resistenza alla forza 2min- 10 min ',
         		    showarrow=False,
         		    arrowhead=7,
		    ),
		dict(
        		    x=0,
          	    y=940,
         		    xref='x',
       		    yref='y',
       		    text= laps["name"][index] ,
                        xanchor='left',
                        yanchor='top',
		    font = dict(
          		color = "black",
         		          size = 20,
		          ),
         		    showarrow=False,
         		    arrowhead=5,
		    ),
		dict(
        		    x=0,
          	    y=880,
         		    xref='x',
       		    yref='y',
       		    text='Duration : ' + str(round(laps ["Duration"][index],0)) + str(' sec.'),
                        xanchor='left',
                        yanchor='top',
		    font = dict(
          		color = "black",
         		          size = 10,
		          ),
         		    showarrow=False,
         		    arrowhead=5,
		    ),
		dict(
        		    x=0,
          	    y=860,
         		    xref='x',
       		    yref='y',
       		    text='Distance : ' + str(round(laps ["Distance"][index],1)) + str(' km'),
                        xanchor='left',
                        yanchor='top',
		    font = dict(
          		color = "black",
         		          size = 10,
		          ),
         		    showarrow=False,
         		    arrowhead=5,
		    ),
		dict(
        		    x=0,
          	    y=840,
         		    xref='x',
       		    yref='y',
       		    text='Ascent : ' + str(round(laps ["Elevation_Gain"][index],0)) + str(' m.'),
                        xanchor='left',
                        yanchor='top',
		    font = dict(
          		color = "black",
         		          size = 10,
		          ),
         		    showarrow=False,
         		    arrowhead=5,
		    ),
		dict(
        		    x=0,
          	    y=820,
         		    xref='x',
       		    yref='y',
       		    text='Work : ' + str(round(laps ["Work"][index],0)) + str(' Kj.'),
                        xanchor='left',
                        yanchor='top',
		    font = dict(
          		color = "black",
         		          size = 10,
		          ),
         		    showarrow=False,
         		    arrowhead=5,
		    ),
		dict(
        		    x=0,
          	    y=800,
         		    xref='x',
       		    yref='y',
       		    text='Avg. Speed : ' + str(round(laps ["Average_Speed"][index],1)) + str(' km/h'),
                        xanchor='left',
                        yanchor='top',
		    font = dict(
          		color = "black",
         		          size = 10,
		          ),
         		    showarrow=False,
         		    arrowhead=5,
		    ),
		dict(
        		    x=0,
          	    y=780,
         		    xref='x',
       		    yref='y',
       		    text='Avg. Power : ' + str(round(laps ["Average_Power"][index],0)) + str(' W'),
                        xanchor='left',
                        yanchor='top',
		    font = dict(
          		color = "black",
         		          size = 10,
		          ),
         		    showarrow=False,
         		    arrowhead=5,
		    ),
		dict(
        		    x=0,
          	    y=760,
         		    xref='x',
       		    yref='y',
       		    text='Avg. aPower : ' + str(round(laps ["Average_aPower"][index],0)) + str(' W'),
                        xanchor='left',
                        yanchor='top',
		    font = dict(
          		color = "black",
         		          size = 10,
		          ),
         		    showarrow=False,
         		    arrowhead=5,
		    ),
		dict(
        		    x=0,
          	    y=740,
         		    xref='x',
       		    yref='y',
       		    text='Avg. HR : ' + str(round(laps ["Average_Heart_Rate"][index],0)) + str(' bpm'),
                        xanchor='left',
                        yanchor='top',
		    font = dict(
          		color = "black",
         		          size = 10,
		          ),
         		    showarrow=False,
         		    arrowhead=5,
		    ),
		dict(
        		    x=0,
          	    y=720,
         		    xref='x',
       		    yref='y',
       		    text='Avg. Cadence : ' + str(round(laps ["Average_Cadence"][index],0)) + str(' rpm'),
                        xanchor='left',
                        yanchor='top',
		    font = dict(
          		color = "black",
         		          size = 10,
		          ),
         		    showarrow=False,
         		    arrowhead=5,
		    ),
		dict(
        		    x=0,
          	    y=700,
         		    xref='x',
       		    yref='y',
       		    text='Max Power : ' + str(round(laps ["Max_Power"][index],0)) + str(' W'),
                        xanchor='left',
                        yanchor='top',
		    font = dict(
          		color = "black",
         		          size = 10,
		          ),
         		    showarrow=False,
         		    arrowhead=5,
		    ),
		dict(
        		    x=0,
          	    y=680,
         		    xref='x',
       		    yref='y',
       		    text='VAM : ' + str(round(laps ["VAM"][index],0)) + str(' m/h'),
                        xanchor='left',
                        yanchor='top',
		    font = dict(
          		color = "black",
         		          size = 10,
		          ),
         		    showarrow=False,
         		    arrowhead=5,
		    ),
		dict(
        		    x=0,
          	    y=660,
         		    xref='x',
       		    yref='y',
       		    text='Iso power (NP) : ' + str(round(laps ["IsoPower"][index],0)) + str(' W'),
                        xanchor='left',
                        yanchor='top',
		    font = dict(
          		color = "black",
         		          size = 10,
		          ),
         		    showarrow=False,
         		    arrowhead=5,
		    ),
		dict(
        		    x=0,
          	    y=640,
         		    xref='x',
       		    yref='y',
       		    text='BikeStress(TSS) : ' + str(round(laps ["BikeStress"][index],0)),
                        xanchor='left',
                        yanchor='top',
		    font = dict(
          		color = "black",
         		          size = 10,
		          ),
         		    showarrow=False,
         		    arrowhead=5,
		    ),
		dict(
        		    x=0,
          	    y=620,
         		    xref='x',
       		    yref='y',
       		    text='Bike intensity (IF): ' + str(round(laps ["BikeIntensity"][index],0)),
                        xanchor='left',
                        yanchor='top',
		    font = dict(
          		color = "black",
         		          size = 10,
		          ),
         		    showarrow=False,
         		    arrowhead=5,
		    )],
)


print(zcol)

data = [trace1,trace2,trace3,trace4,trace5,trace6,trace7,trace8,trace9]

fig = go.Figure(data=data, layout=layout)

#Aggiunge la legenda
def add_legend_data(fig, legend, zone_colors):
    # workaround to get a custom legend
    for i in np.arange(0, len(legend)):
        fig.add_trace(
            go.Scatter(
                x=[None],
                y=[None],
                mode='markers',
                marker=dict(size=10, color=zone_colors[i]),
                legendgroup=legend[i],
                showlegend=True,
                name=legend[i],
            )
        )

add_legend_data(fig, legend, zone_colors)
fig.update_layout(showlegend=True)

plot=plotly.offline.plot(fig, auto_open=False, filename=temp_file.name)

GC.webpage(plot)
If you need information, just ask.
THANKS TO ALL