Love the tool and concept! I do have a question and maybe it’s hidden somewhere but couldn’t find it. The tool was working fine until I had to miss a HRV reading one day and now it hasn’t plotted the HRV Z-score for more than a week.
I am aware of unpredicted behavior when some data is missing but haven’t got around to fixing this. Bare with me please, I’m totally new to any kind of programming and learning the hard way
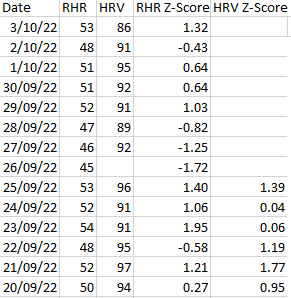
Your easiest workaround for now is to input an interpolated value for that day. In your case, just manually input 94 in the HRV wellness field on for 26/09 and you will be good.
You have changed something to the formula’s because normally an empty field returns an N/A result in the HRV Z-Score. And that means no dot and no valid avg for 30 days…
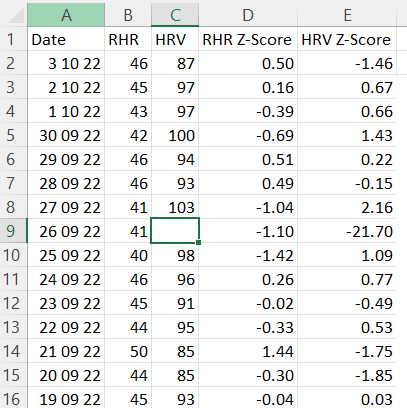
I have to think how I’m going to handle this because, while you have a value (-21), it completely falls of the scale and you will not see a dot on the chart for that day. The off-scale value influences the 30 day avg and the SD quite a lot.
For those reasons, I can’t use N/A or 0. Needs to sink in, and we will see how to handle it.
Part of the problem is that the HRV cell contains a formula. And thus it isn´t blank .
Can be frustrating in MS Excel…
The correct way to do it is allowing blanks and exclude them for the average and SD calculation. That’s what I’m looking into. You should not get a dot for days without measurements.
This should resolve the issue of the score changing, but I do notice it pushes the Orange (today) to a Green (today) as it doesn’t take into account my score from yesterday.
Ideally the chart should show what today’s training should be, which in this example is limit HIIT, which is borderline between the Green and Orange.
Nice!
Small changes in SD are no big problem. A value that significantly influences the HRV average on the other hand, is to be avoided because it shifts the whole graph. Remember that the averages determine the center point of the graph!
A borderline dot isn’t going to have a huge impact doing one or the other. That’s explained in the chart description.
I will have a look at your modified file as soon as I find some extra time. Probably the coming weekend.
Thanks for your input!
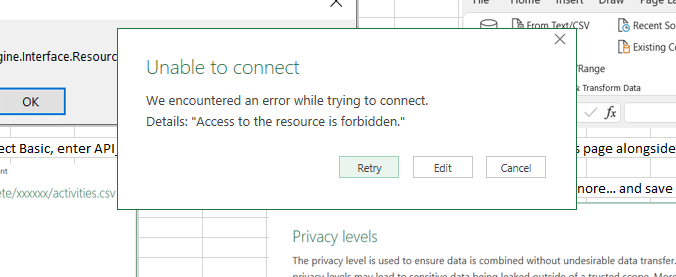
Looks like something went wrong when trying to set the access permissions.
If you are on Windows, go to ‘Get Data’ - ‘Data Source Settings’. Select Global Permissions, Edit Permissions. Set Privacy level to None then Edit credentials, Basic. User is API_KEY and pw is your personal API-key.
That should do.
If you’re on Mac, there seems to be a security level that does not allow getting data in this way and you will be forced to use a local wellness file.
For the local file the data for RHR and hrv is correct but there is an issue with the date format. From the first screenshot I see that Office has the en-US regional setting. Do you have the same setting system wide? Is your date on the taskbar displayed in US format (yyyy-mm-dd)?
A local downloaded file comes in with this format but is interpreted using your regional system settings. And then is again interpreted by Excell to display it in the choosen date format. Check on the wellness tab if the date is correctly displayed.
EDIT: my mistake, I forgot to enter the source origin in that file. It’s done now, so it should display the dates correctly and be functional. Sorry about that.
It’s from iThlete but all the info to reconstruct it can be found for free on their own website. Haven’t seen any copyright or TM symbols.
To be honest, not 100% sure if I’m doing something illegal but I don’t think so, as long as I’m not commercializing this.
What you indicated is a footnote in the footer of the page and it does not indicate what is covered by the patent, to what extent, under what number, etc.
Thanks for the reply. You’re a gent.
I’m not sure what was going on. Tried all you said there for the API connect and still wasn’t working. I deleted the file altogether and re downloaded. This time it works. Had to enter the api password on 4 occasions but then it just pulled all the data in.
Working now.
Thanks again

 .
.