Hi all, have been using intervals for looking at data for a while now but am currently making the switch from training peaks for planning workouts etc. My fitness graphs look so wildy different between the two despite the same ftp values and I am struggling to understand why. Given the amount I have been training, the trainingpeaks graph looks more realistic as my fitness peaks with the workload. Whereas in intervals it definitely does not, and doesn’t ramp at a similiar rate to TP. Any ideas why this could be?
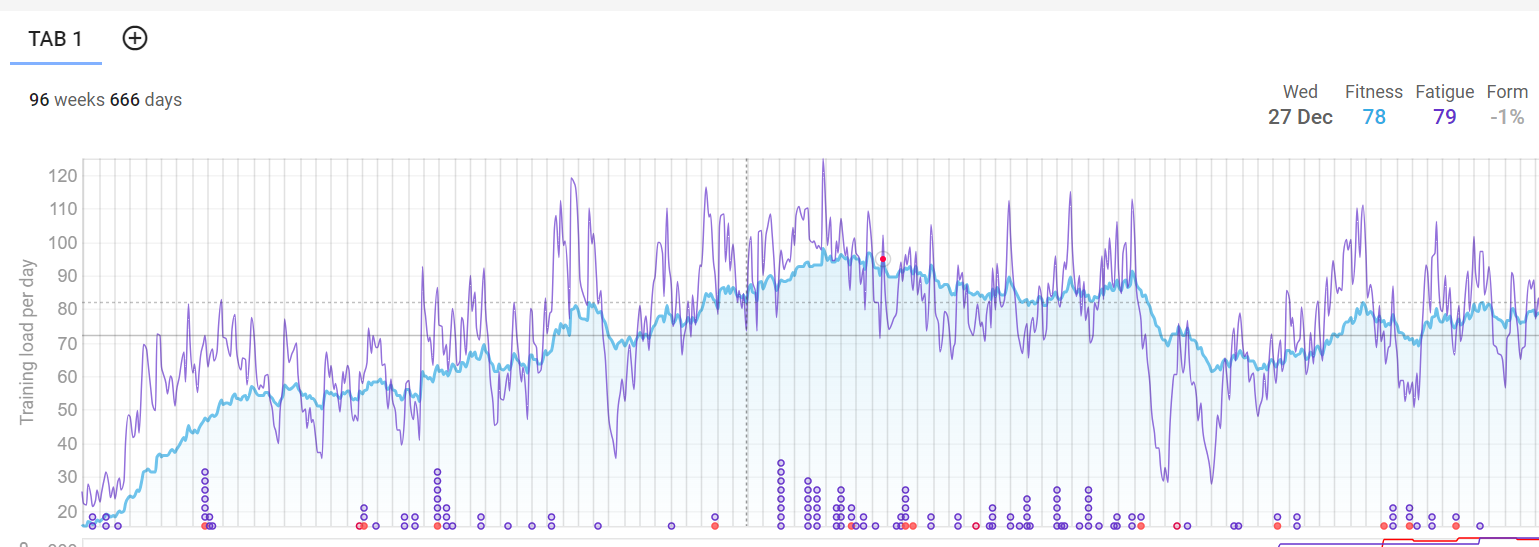
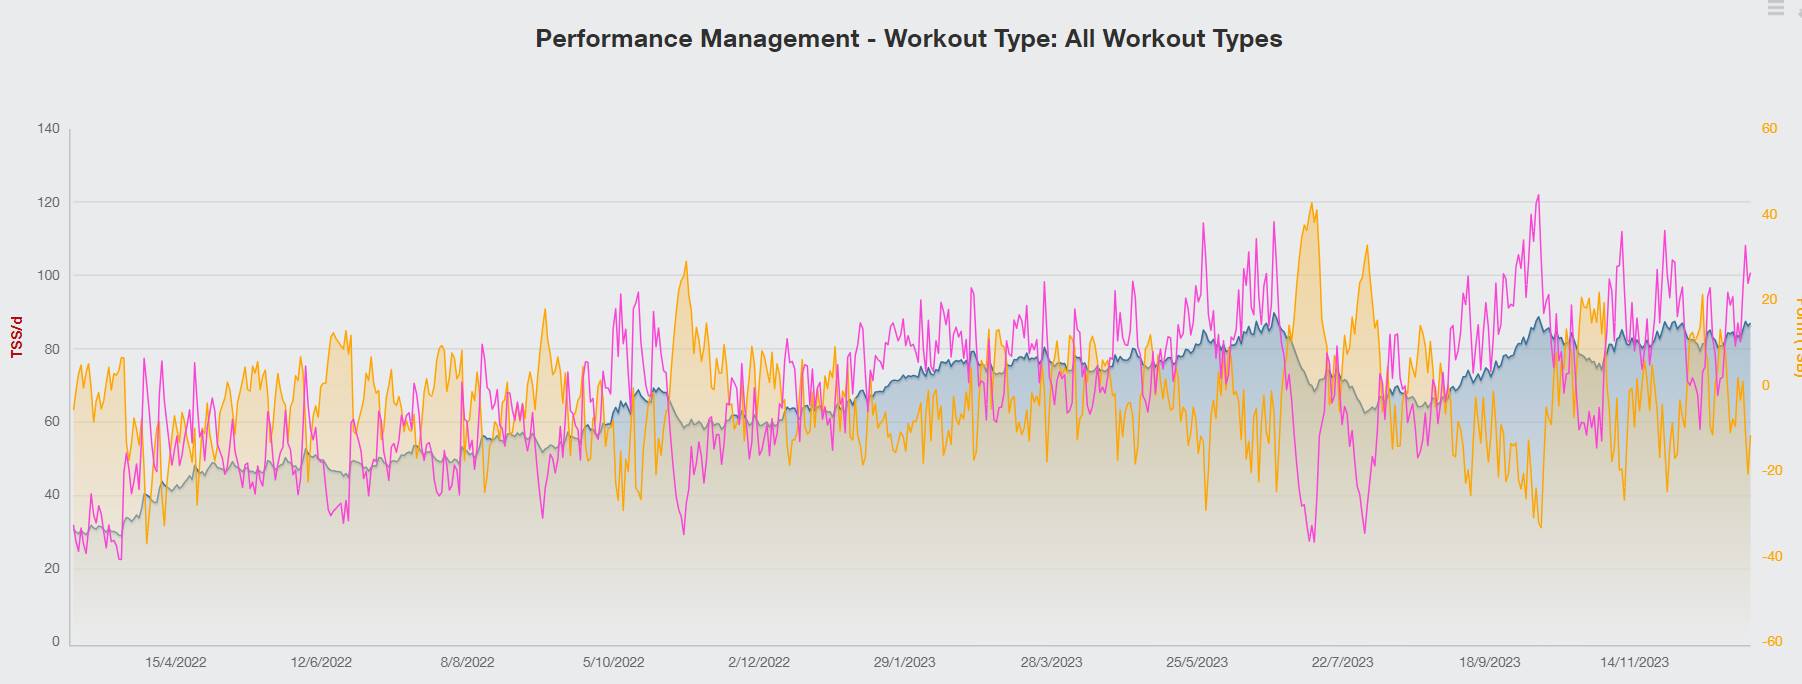
The profile is similar, but your Intervals chart shows a start from zero. Do you have the same data in both applications?
How is your load being calculated? Power only, HR only, a mix of power and HR?