I’d like to add some kind of planned/predicted line to the fitness/form chart.
Right now, when I schedule workouts 8 weeks ahead, it shows the fitness line according to the plan. But I’d like to see something like the ‘real’ line (i.e., without training—how it goes from optimal to transitional) and this ‘planned’ fitness line as a dashed transparent line.
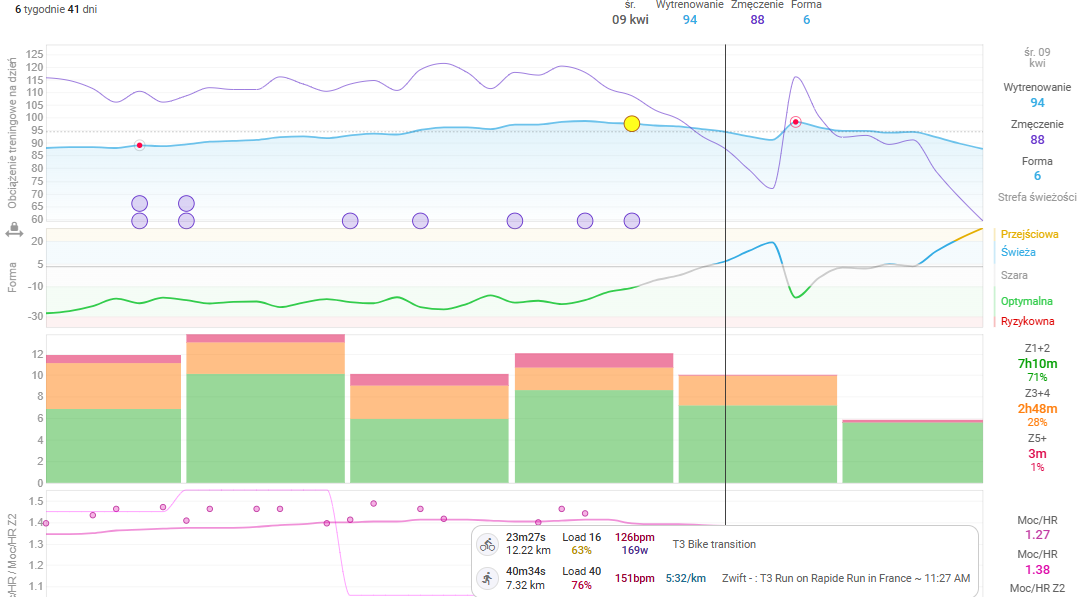
Not sure if I understand this correctly. You do see the ‘real’ line up until the present day and then you see the projection accounting for the future planned workouts.
Would you like to see what happens if you don’t train versus following the plan?
In a way, yes – but right now it’s just a single line. When I add workouts several weeks ahead where I define the load and duration, I can see how my fitness/fatigue changes.
I’d like to split these lines: one up to today, then a continuation showing what would happen without any training (real line), and a dashed line for the planned workouts (let’s call it a simulation).
I don’t see the need for the continued “real” projection without training, but I do agree that it would be nice visually to make the “future” part of the graph dashed. When you start moving around the graph the light gray line stays at today but making the future dashed too would make it easier to visualize.
That would be such a great future. I really see the need. I would like to compare the plan (simulation) with the real impact. It not just for „what happens without training“.
As an amateur rider you often have to to take chances for training and sometimes it is longer than initially planned - or even shorter. In both scenarios it would be helpful to compare both lines to be able to check whether the TSS impact over a longer period is sufficient or not (besides the content of each training).
What you wrote is great, an improved version of my idea.
So, the dashed line represents the simulation, and the solid one is the real data, and not only future workouts are taken into account, but also past planned ones (whether completed or not, longer or shorter), for example, 7-14 days back from today. That way, you can see how the real value deviates from the plan.
That’s how I understood it, was that what you meant?
I mean, what is the benefit of a training plattform like intervals.icu or many others. not just analysing single trainings and the produced data.
most of the time, I am using intervals.icu, is to compare my training load, time on the bike, kilometers, etc. in comparison to the previous years and in comparison to my FTP and VO2Max.
That is already possible now with the section “analysis”. But this is only possible for a greater period of time and the reaction to any deviations would take too long or it is too much time gone until you’re able to draw any conclusions.
to be able to check whether the training is going in the right direction you need more than this. you need a plan (simulation) and a constant check whether this plan is kept or not. And that would be your or mine (=our?) idea.
it would give us the possibility to check your fitness/form development immediately and you can react in a short term. either with a reduction of the training load or with an increase.
@david : it would be great to give this a chance. I see a huge benefit in this and it might be a kind of USP of intervals.