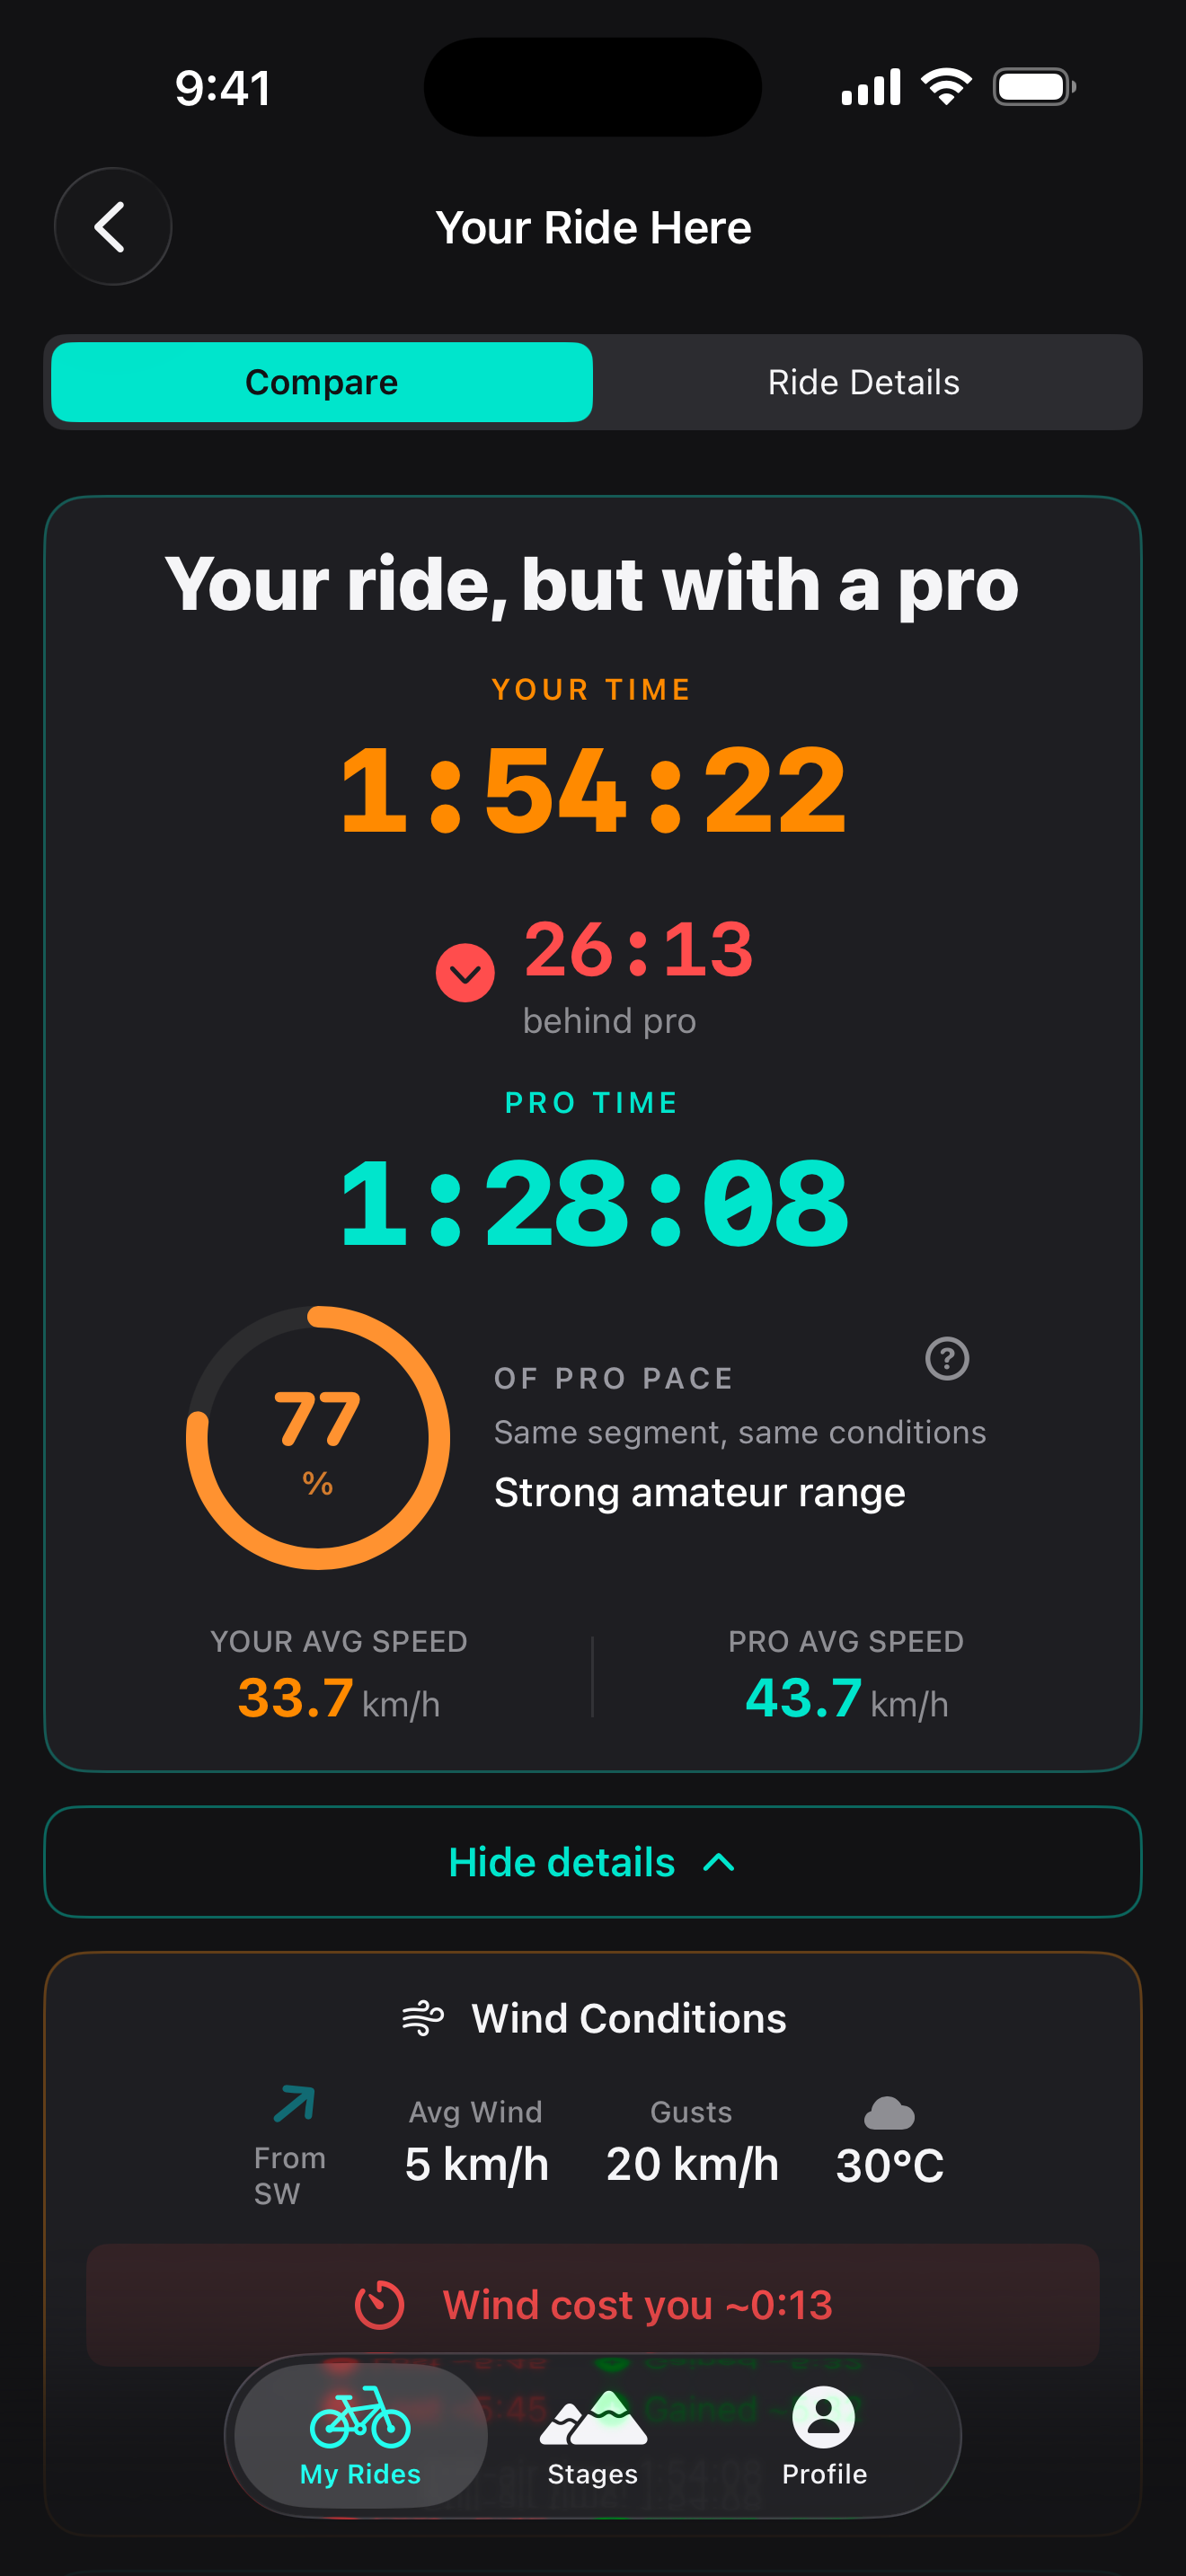
I run the comparison in the opposite direction to the usual one, and that turned out to be the whole reason I built it.
The common way to ask “how close am I to a pro” is to take an observed climb time and back out the power that must have produced it. That back-calculation is fragile, because a small error in weight or drag moves the estimated wattage a lot. ProPace never does that. It starts from a defined pro reference and simulates that rider forward over your exact GPS trace, in the wind and on the gradients you actually rode, to produce a predicted time. Your result is a time ratio against that, a percentage of pro pace. Because the model only ever runs forward from a defined profile to a time, it structurally cannot be pointed at a real person to estimate their watts.
The reference is the GC group’s pace at a Grand Tour, the bunch chasing the overall, not the stage winner. That was deliberate. The winner is an unbeatable goalpost, the GC group is a number a strong amateur can actually chase. The men’s reference sits at 383 W, 5.80 W/kg, 66 kg, and the women’s at 288 W, 5.05 W/kg, 57 kg, both at the bottom of the GC contender range rather than the top. The women’s model is first class rather than an afterthought, which is rare in this category, and it is the reason I timed this around the Tour de France Femmes.
Under the hood it is a Newton-Raphson power-balance solver run per gradient segment, so gravity, rolling resistance, drag and drivetrain are solved for the speed where required power meets available power. It accounts for fatigue and W-prime depletion over the duration, drafting on the flats that fades out as the road tilts up, a thin-air penalty at altitude, and air density that changes with temperature. Elevation comes from GPXZ, lidar grade where it is covered and Copernicus 30 metre globally, which is a real step up from the year-2000 SRTM a lot of tools still fall back on. Wind is historical hourly data for the day you actually rode, so a block headwind is credited back to you rather than logged as you being slow.
The honest caveat, and I would rather this audience heard it from me first. The power-duration curve is fitted only to solo efforts, five Grand Tour time trials plus five solo breakaway finishes, never to bunch stage times. So the pro times the app shows will not match published stage results, and that is by design. A stage result is a peloton time with drafting and tactics baked in. Fitting solo no-draft physics to those would force the constants upward and quietly inflate every number downstream. Horvath and Andersson (2025, Front. Sports Act. Living) make the same point from the other side, that this class of model loses predictive power on bunch races without extra handling of in-race dynamics, so I disowned that direction rather than fudge it.
The full write-up of the model, the equation, the data sources and both reference profiles is here: https://propaceapp.com/how-much-slower-than-a-pro
It is iOS only, built and run solo, no VC and no PR. Rides come in from Wahoo, from .FIT files, so if you keep everything in intervals.icu you can export a ride and drop it straight in, or from recording on the phone with BLE sensors. There is no Strava or Garmin import yet, Strava because their API rebuild is ongoing and Garmin because their program is closed for now. The free tier gives you three rides, all of the 2024 Tour de France for your gender, wind on every ride and elevation for everyone, which is enough to run the full comparison flow. One stage from the paid tours also rotates free for everyone each week, and this week it is Mont Ventoux on the women’s side and the 2026 Galibier and Alpe d’Huez queen stage on the men’s.
Pro is $4.99 a month or $29.99 a year for unlimited rides, the other tours, the Coggan and power-curve views and the share stats.
If you try it, the two things I would most value back are bug reports and feature requests, especially anything about the model itself, the calibration set, the data handling or the math. I will answer all of it here.