Can we set the chart to use “only” power or HR data for each chart?
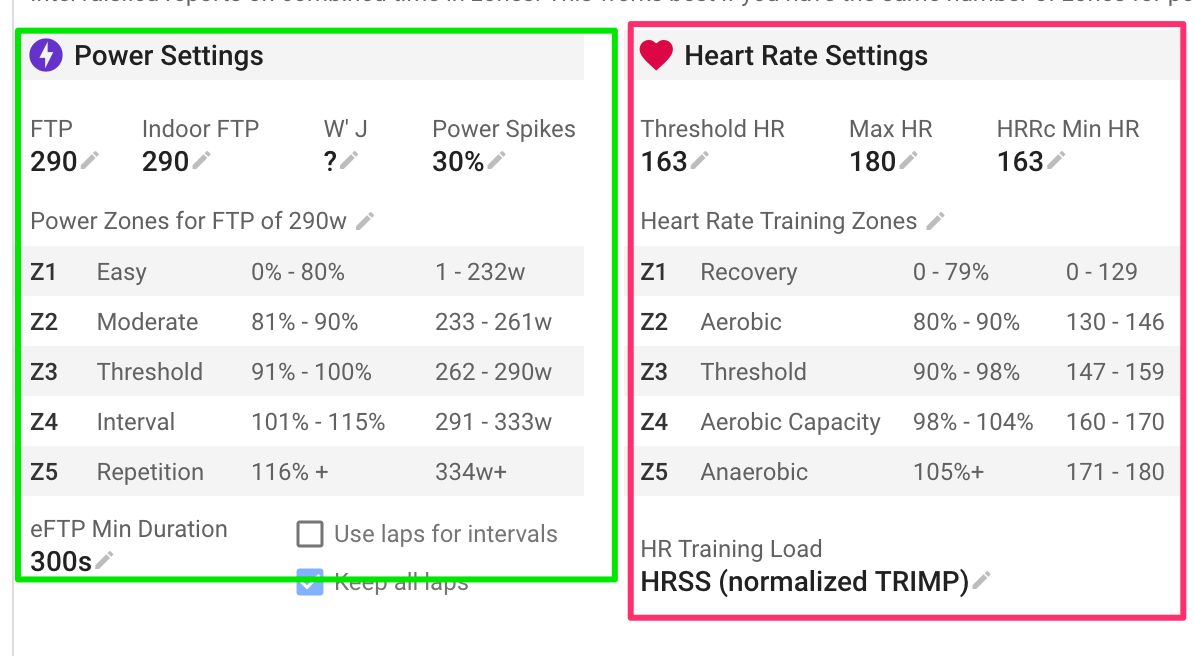
I’d love to see how my “power zones” go against my “HR zones”. I do mostly trail run with Stryd, so my HR zones are a little hectic sometimes. Stryd zones give me a better idea of my performance.
How does your Stryd power comes to Intervals? Do you just have one power datastream that comes in by default or did you setup a custom stream?
If you have just one Power stream coming in without any further action, this should simply work.
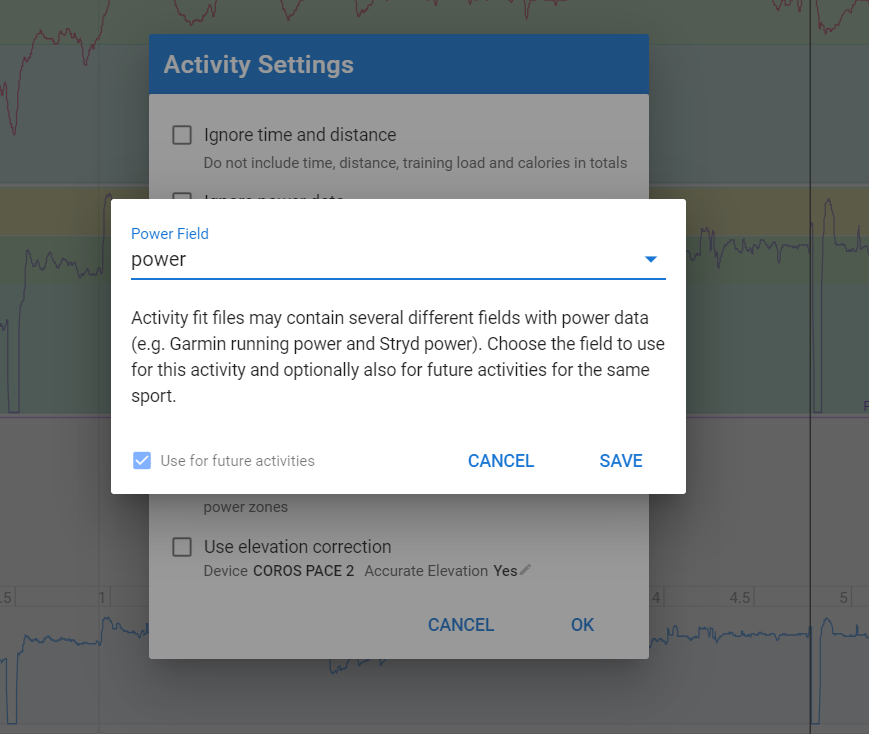
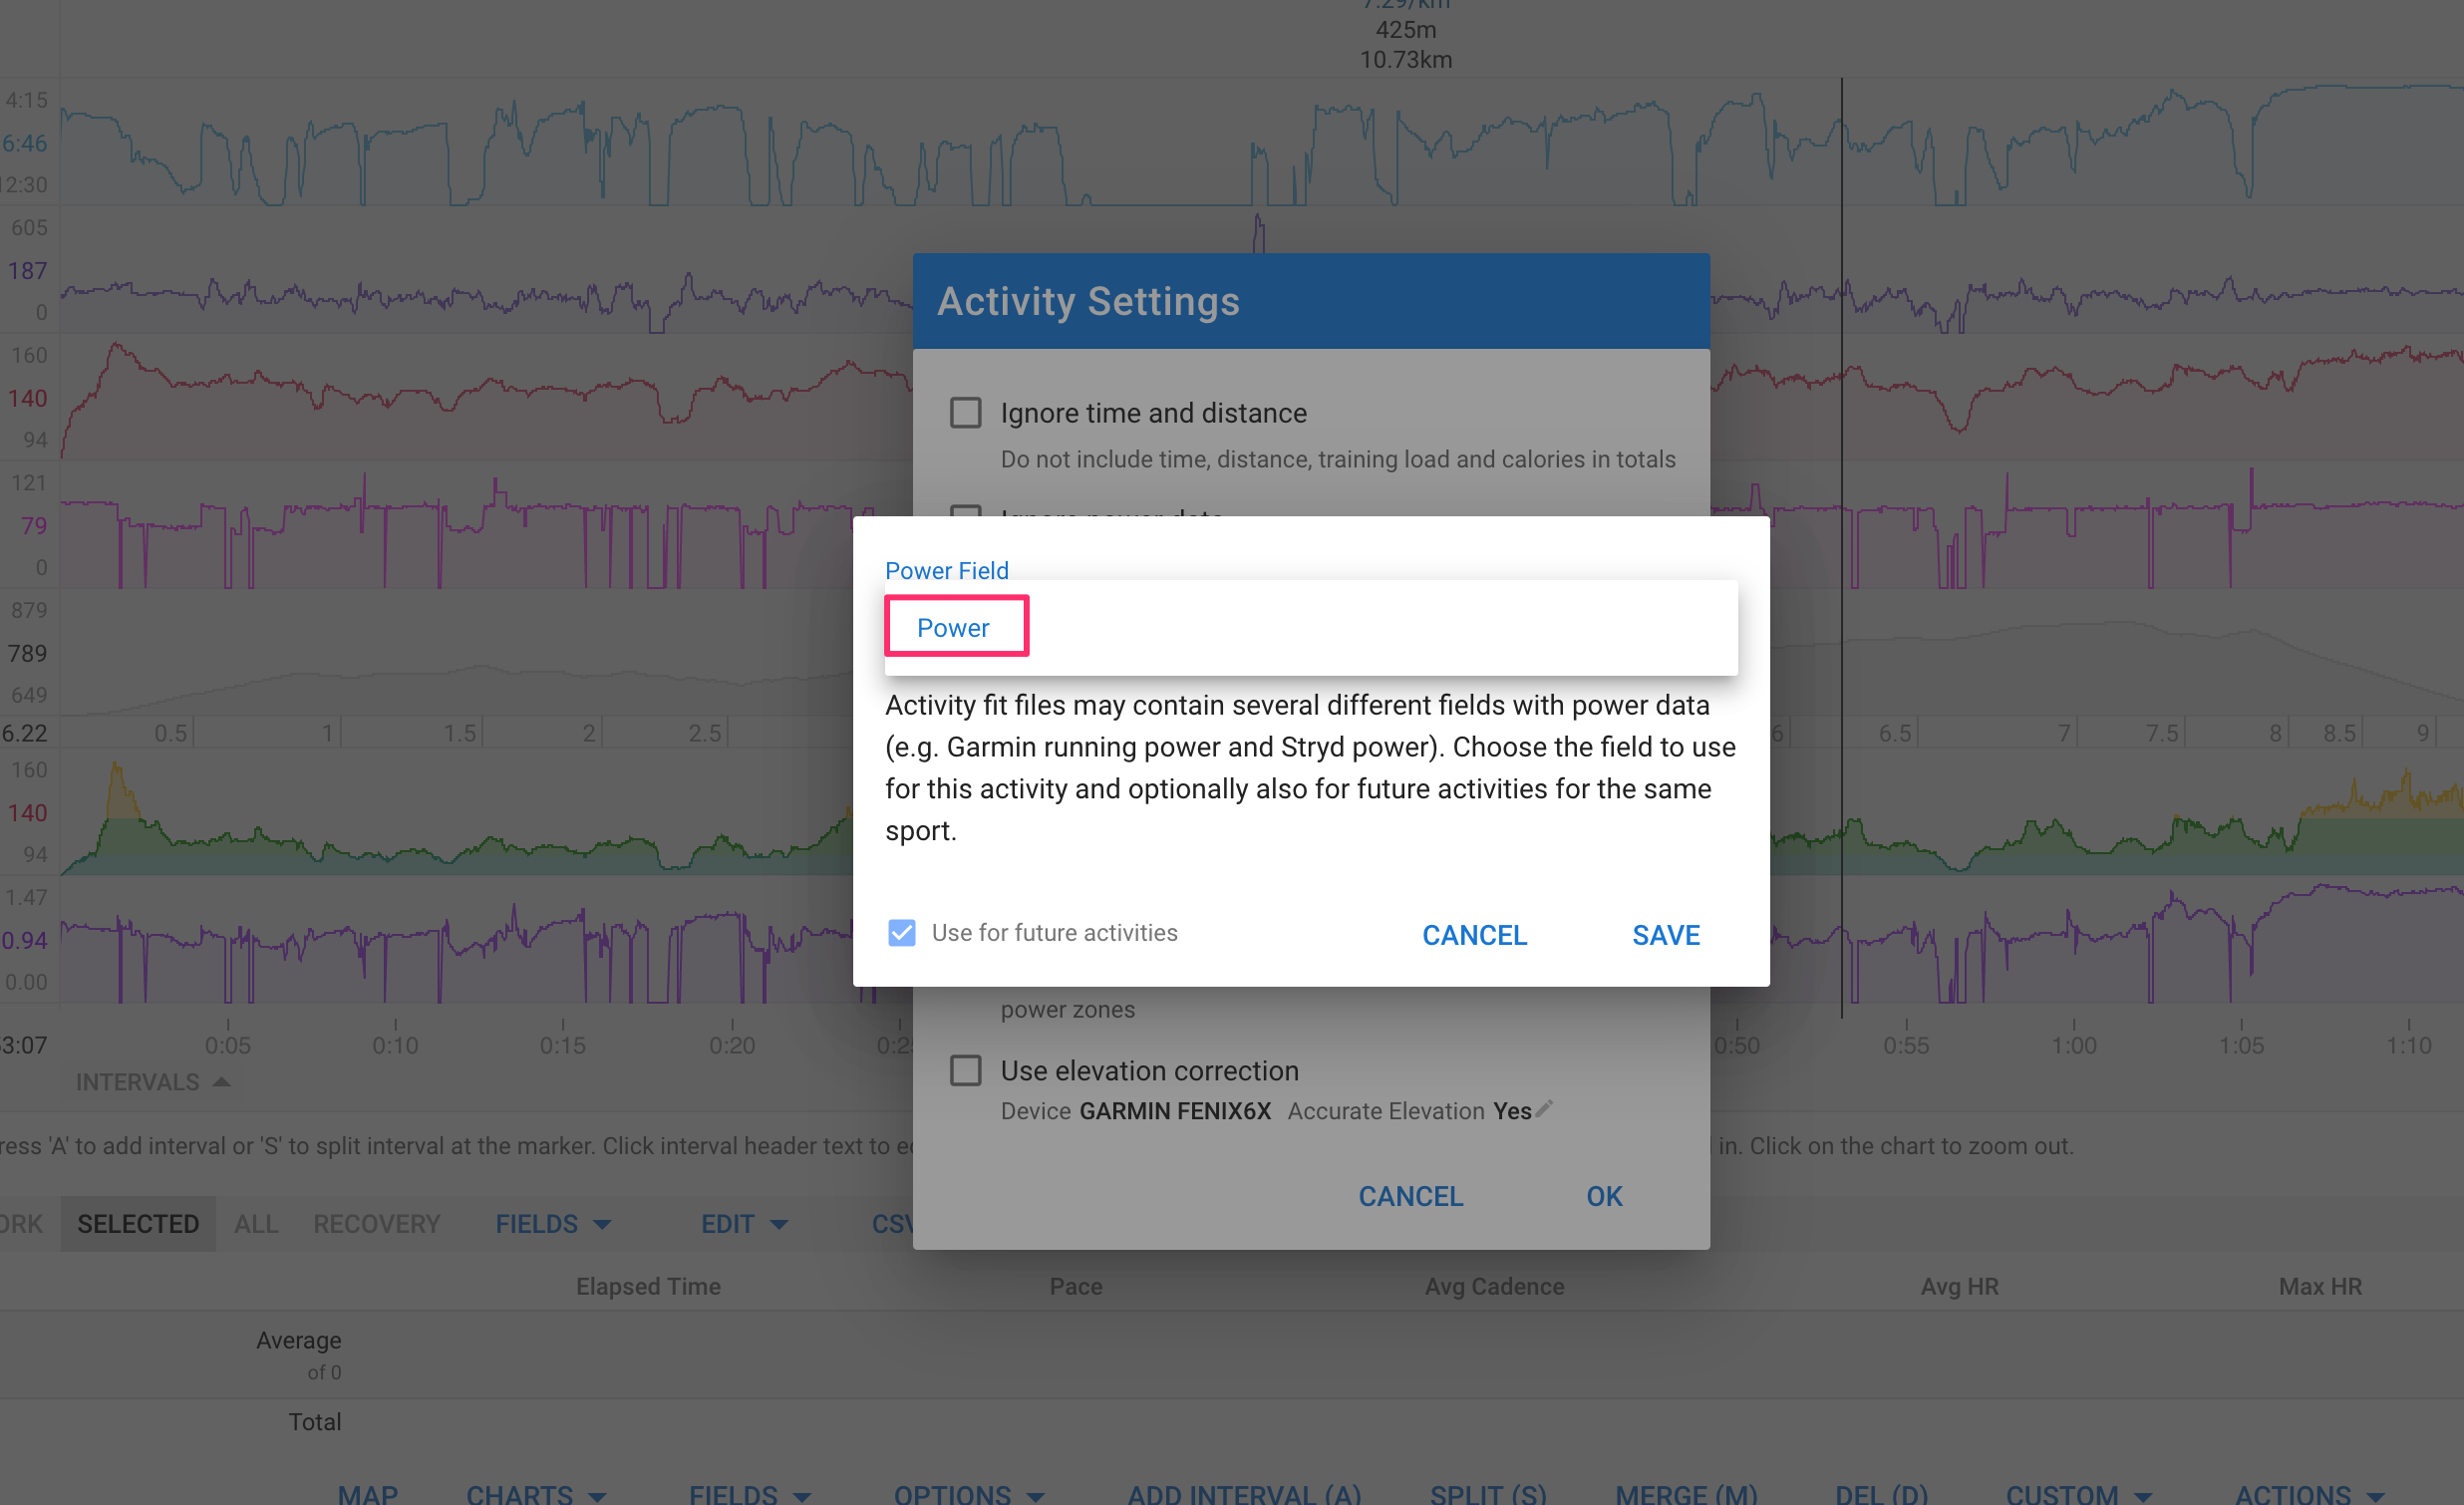
If you have more then one power datastream, you can set the one you want by default through the Actions - Settings menu.
*If you have just one Power stream coming in without any further action, this should simply work.*
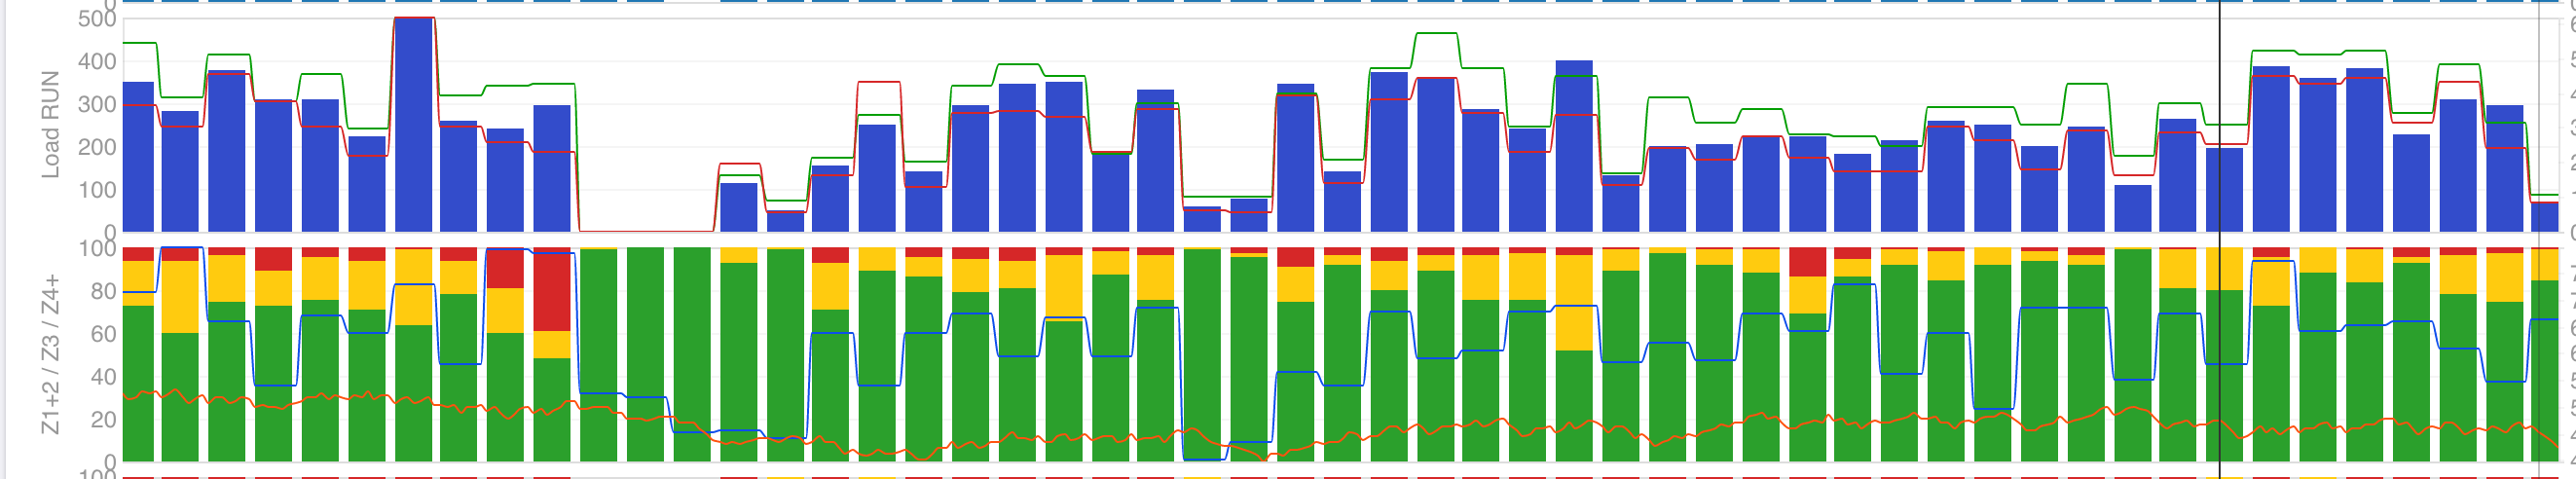
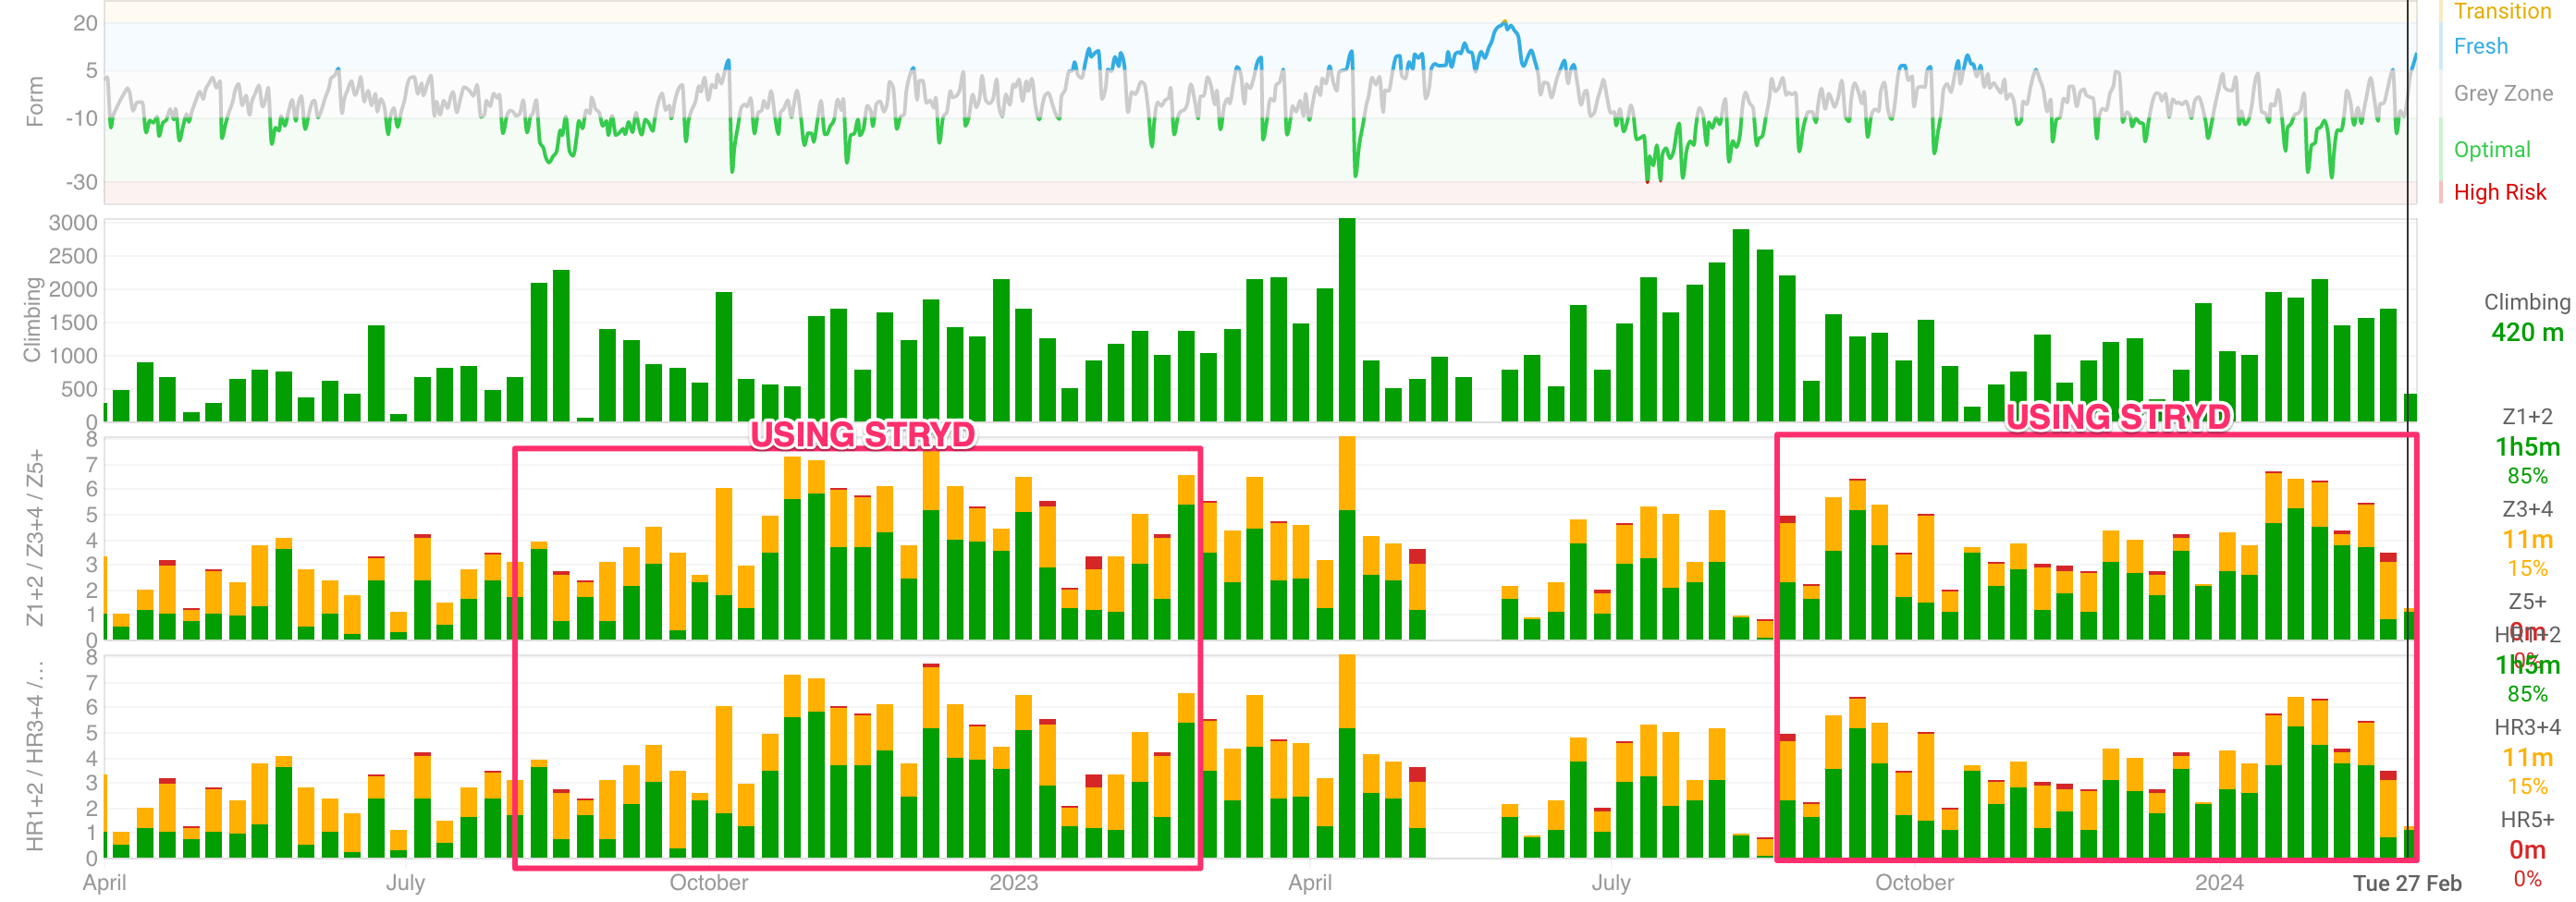
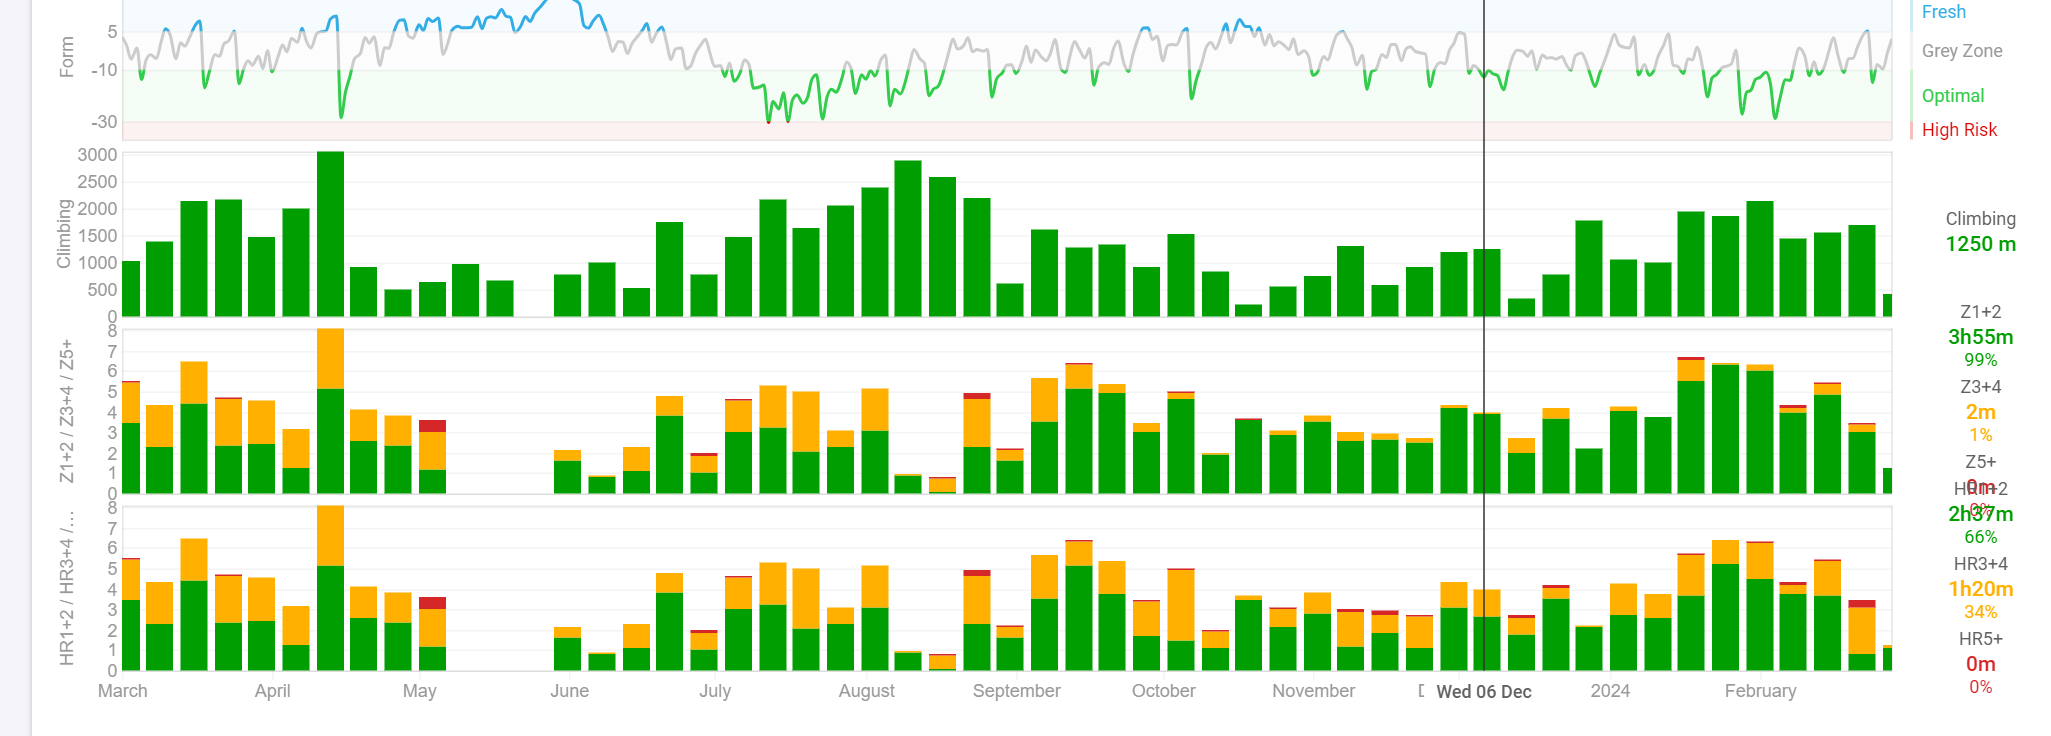
I guess there’s something going on here. According to what you said, I shouldn’t be seeing “data” on the “Z1+2…” chart in those date periods where I wasn’t sending power data (july 2023, as an example):
Ah, I think I know what’s wrong…
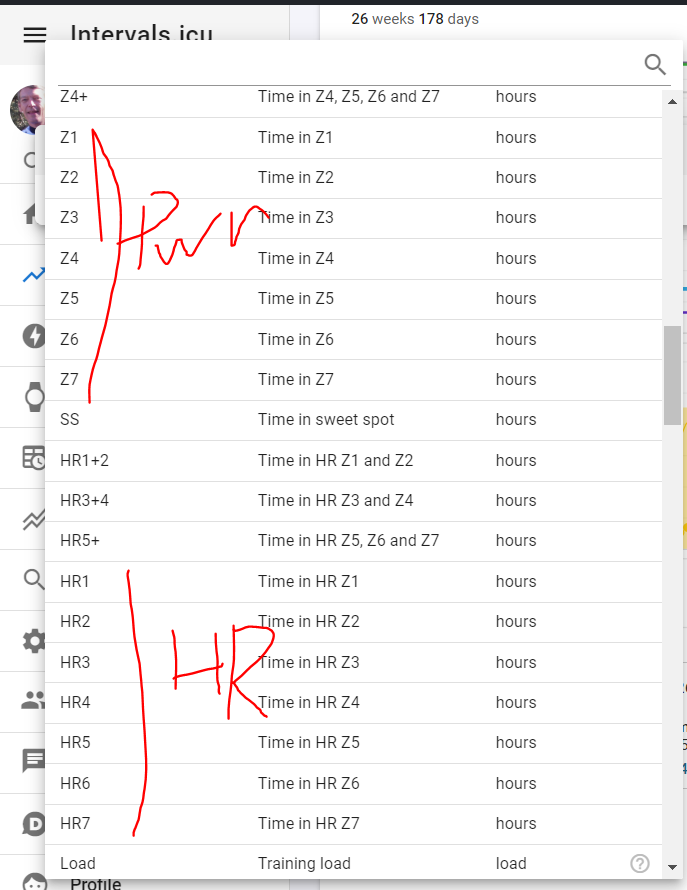
The Zx zones are not necessarily Power, they are what has been defined as the priority for TIZ for that specific sport.
Go to the settings page and change that order to Power, HR, Pace. I’m pretty sure that you have it now on HR, Power, Pace. And then TIZ is calculated with a priority for HR if available. You want that on a priority of Power. Then it will only use HR if power is not available on the activity.