I notice that the default “Power spikes of 20% or more above FTP have been fixed” is breaking the data from max power tests.
Strava already reports inaccurate data.
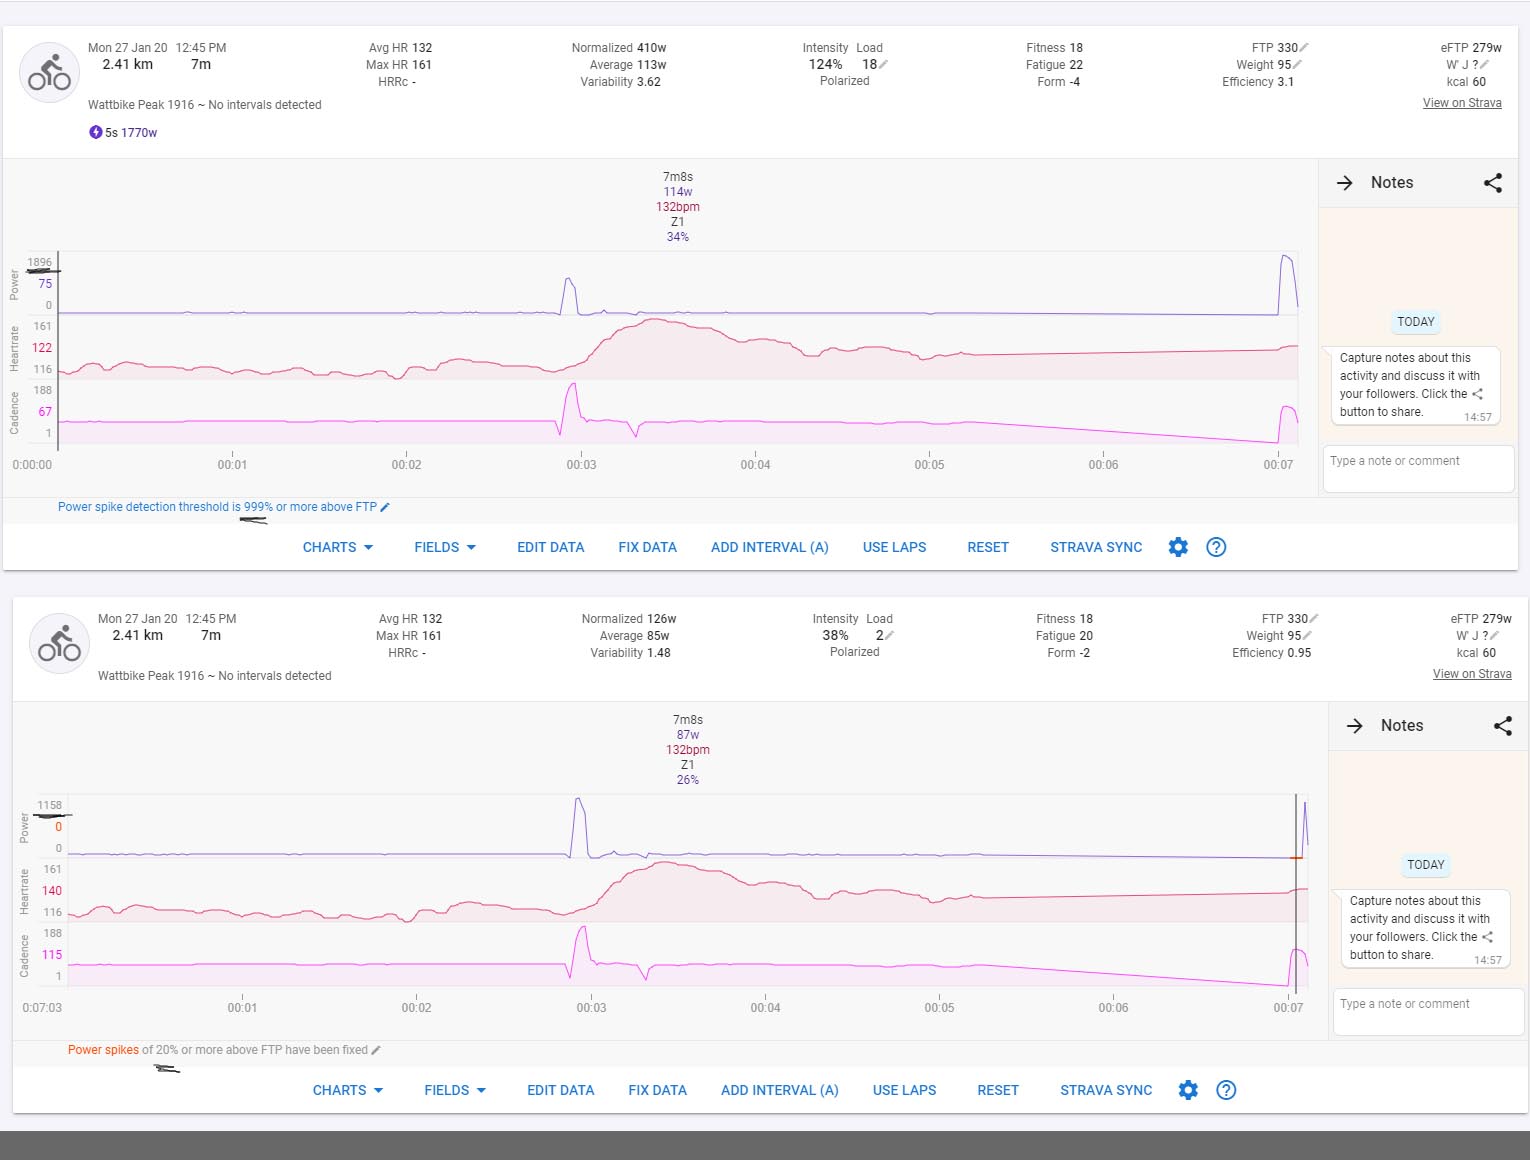
In this example
Watt bike reports peak of 1916
Strava reports peak of 1896
intervals.icu reports peak of 1153
This means your data for short efforts in the power display is incorrect, setting power spike correction from 20 to 999 has moved me from all rounder to sprinter catagory.
I think the description is a little bit awkward, or my understanding of it, whichever is more likely
“If your power output for a given duration is more than the power spike threshold percentage above the power curve for your FTP then that is considered a spike and fixed.” I would think that any sprint will be likely up to 400% or 500% of your FTP, but if you look at your power curve, it correctly shows your sub 30 second power values are showing that.
At least for me - if yours doesn’t show your 1800+ power values, something is amiss, but it’s kinda strange that this would be fixed by setting that spike percentage to infinite…
(Okay, maybe 400 - 500 is a little over the top for most, but let’s make it 300 - 400 then I get stuck at 300 anyway )
I’m not quite sure what you mean but yeah I feel like something is amiss.
This is a screenshot of data with both the spike threshold set to 20 and 999.
It looks unusual as this is a watt bike session with specific intention of max power testing. The max power is right at the end.
Okay - @david, can you please shed some light on this? ‘Power spikes of 20% or more above FTP’ doesn’t seem to be (a) right (description). As I said, ANY all out sprint will be well above 20% of your FTP.
It may be more than 20% above your max detected (so far!) 1 - 10 second efforts, but that’s something else.
It is as @Cyclopaat said earlier in this thread its a percentage above the power curve for your FTP. So if your FTP is 300w then the curve says you should be able to do 448w for 60s. If the power spike threshold is 20% then it will kick in if you do more than 538w for 60s (448 * 1.2).
If you are confident in the power numbers then just bump the threshold up until it isn’t clipping your ride. Then go set that as the default in /settings.
There are many power meters out there that do dodgy things sometimes (e.g. when running out of batteries) and if you don’t try to fix those then any long term power stats (and related things like eFTP and the age group rankings) are hosed.
Thanks for the reply, I just thought I should bring it up as it seems like with the current implementation the long term power stats are hosed as it’s not working for people with a power curve like mine. I assume not everyone has worked out how to fix their data so the comparison of my figures to the acquired data is not valid.
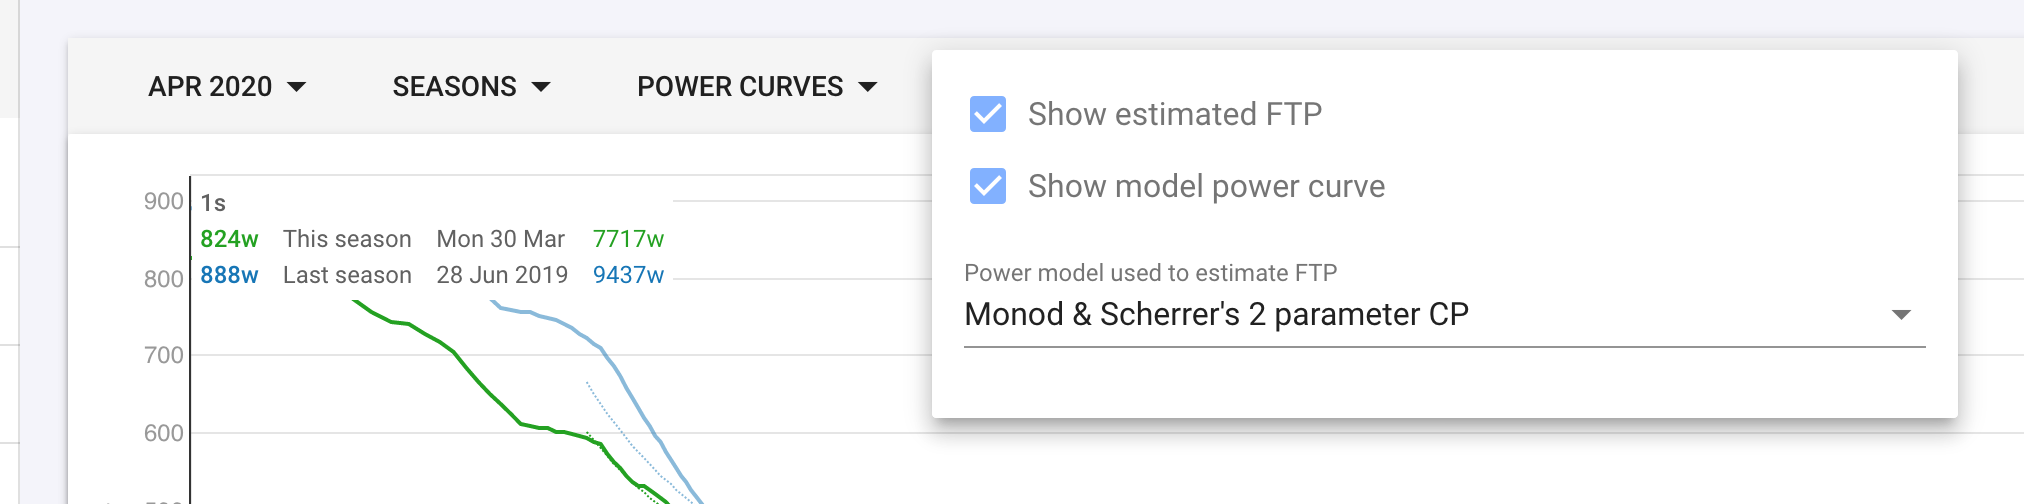
However this still doesn’t quite add up, if I enable the “model power curve” display on the power chart with an eftp of 340 (I had manually entered ftp in my profile as 330 so not sure which one its using) it peaks at just under 1400, so *1.2 should let my power data reach 1680, not the 1158 as displayed in the initial screenshot.
TBH I never used that model - it doesn’t hold water anyway, as it levels off at FTP value, which is not sustainable after 40 - 70 minutes, depending on the athlete (let’s keep 1 hour, for arguments sake).
However, I’m guessing that model doesn’t take the threshold value (%) into consideration, only your calculated (best efforts) for any given time frame, probably seasonal, i.e this season vs. last season, or whatever you’ve set.
Note that if you have set 42 days or something and your last similar hulk effort was before that, it may also get cut off…
The number on the right looks like a bug to me, on mine its the same as the left number but when I click on the row it takes me to the specific workout the power figure came from (nice feature). However when I go back to go to the power chart again its gone, and makes more sense being gone.
Edit: ermmm I checked again and none of what I said is true
If you don’t have the correct inputs M&S 2P and Mortons 3P don’t work very well. Mortons 3P is good if you have good inputs (I can’t remember exactly what those are: max for 5s, 3m, 12m or something, all recent). Thats why Intervals.icu uses predefined power curves and single max efforts. Its not quite as nuanced as Mortons 3P with good inputs but much more reliable.

 I get stuck at 300 anyway
  but yeah I feel like something is amiss.