Sorry if this is intended, but for the power load and hr load plots there are “zero” values being plotted when there are no rides, which is different behaviour to the other plot types.
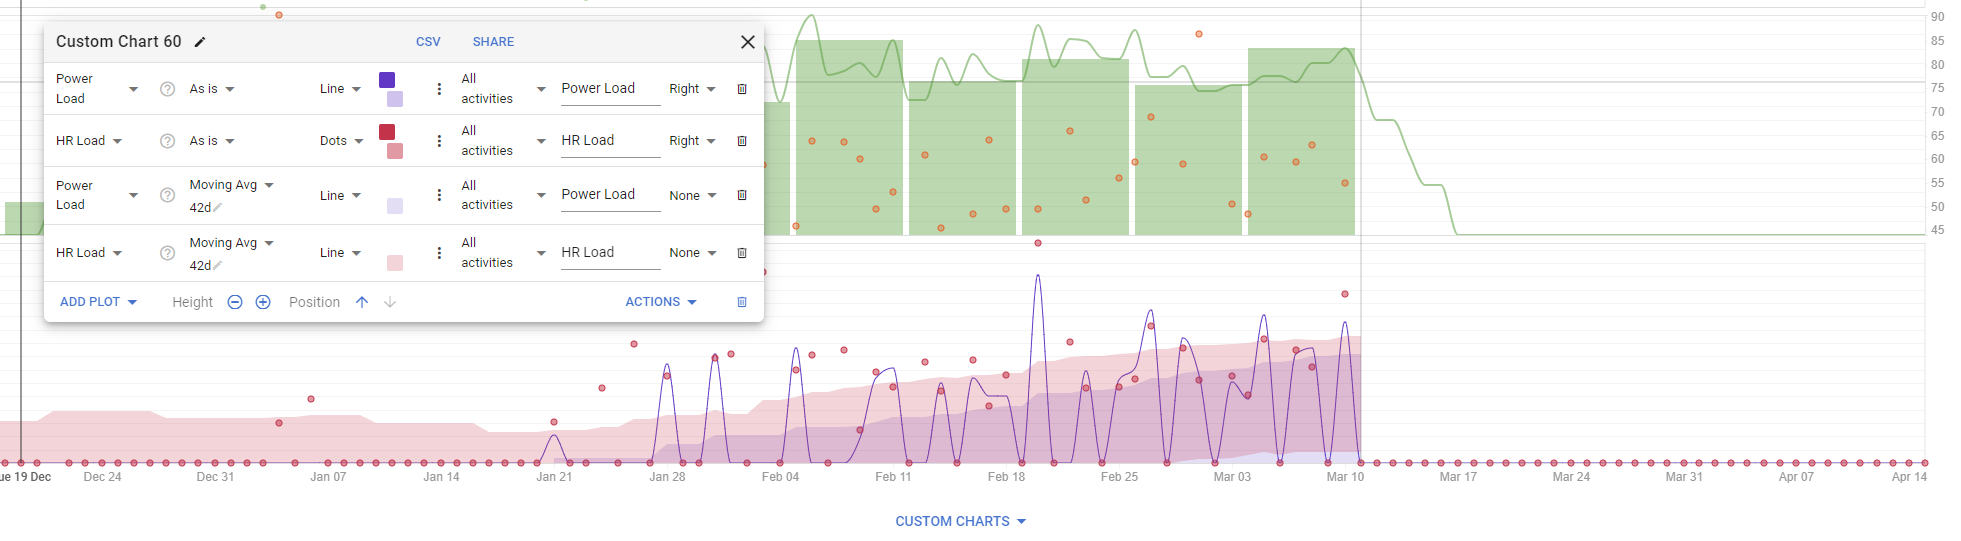
Unlike some other plot types if you didn’t ride on a day then the load for that day is zero (power or HR). So it is intentional. Is that causing an issue?
I was just curious about plotting my averaged power load vs hr load over time, and because the averaged results are taking into account all these zeros it isn’t really representative of my load per ride. To contrast it against say… the work plot, I’m doing zero work on days I don’t ride but it’s also not plotting zeros on the graph like the load plots are. I’m not really that fussed about getting it changed if it was intentional, but why one but not the other?
Edit: Wait now I’m so confused because I went back to compare it against a work graph, and now the averaged line is different to one on a graph I created previously when they should have the exact same setup.
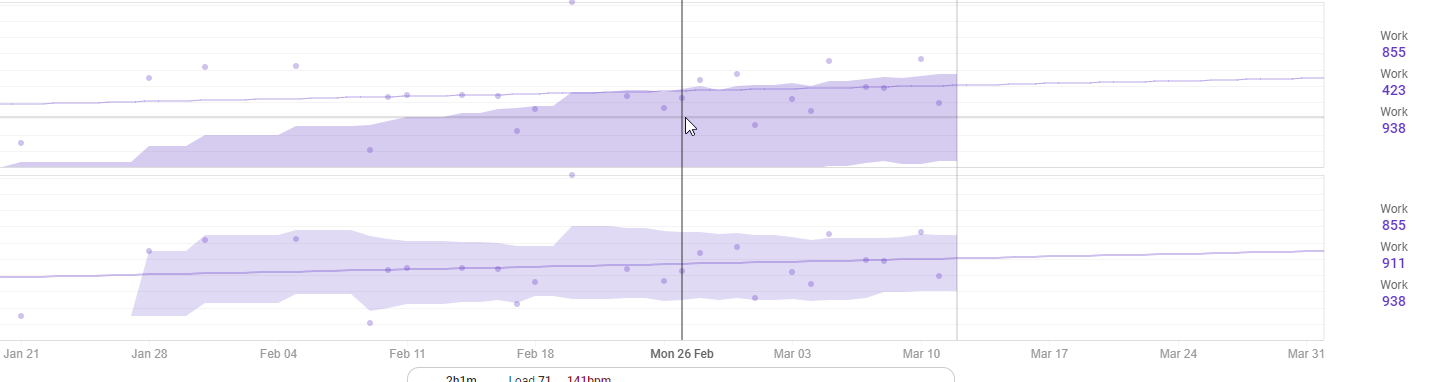
Do they?
Show the setup for both, there must be something different. The second ‘Work’ number is way higher. Shorter avg period?