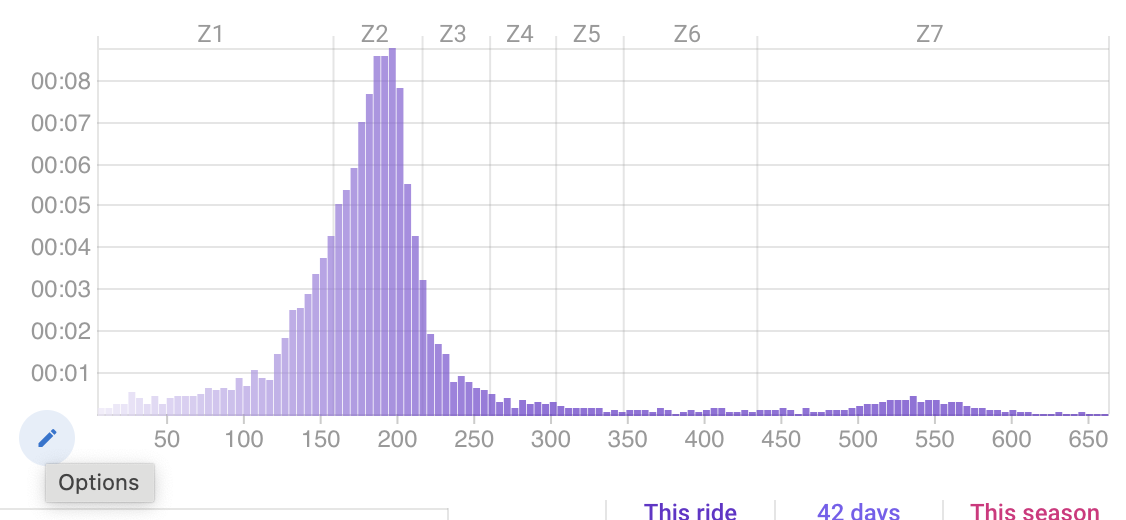
Hi everyone,
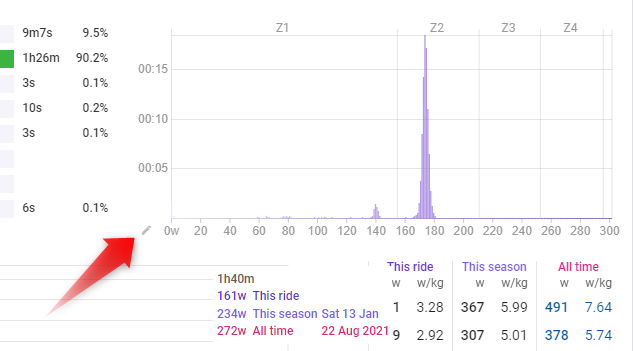
does anyone have a custom chart to share for the power section of activity in which I can choose the dimension od power “buckets”? In the default cher the “buckets” are fixed at 25 W dimensions:
Thanks!
Hi everyone,
does anyone have a custom chart to share for the power section of activity in which I can choose the dimension od power “buckets”? In the default cher the “buckets” are fixed at 25 W dimensions:
Thanks!
Ooooh that’s fantastic. Love it.
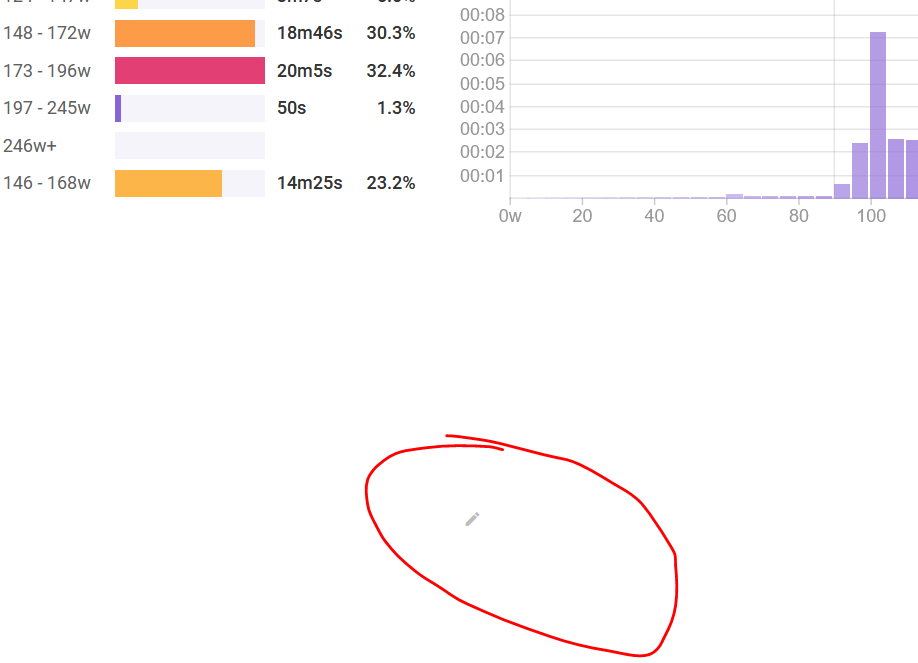
The fact is, I’m looking it in a large screen, and the options button disappears…
But if I resize the window, it pops up!
Nice! Thanks!
Wow, never noticed that before. Learned something again.
I keep forgetting about these features; perhaps a “tips & tricks” topic is needed.
The pencil remains in place, for me, on a laptop.
Which browser are you using?
I experience the same issue on a 2560x1440 monitor using Firefox.
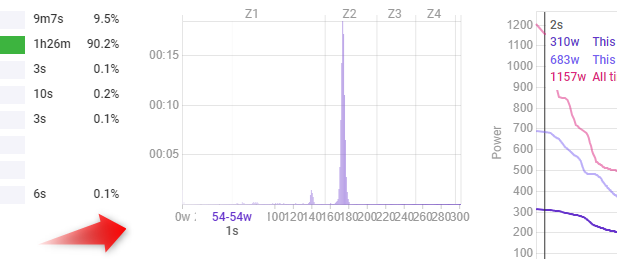
It seems that the issue is related to the height of the ‘Best efforts’ table, which I’ve configured to show 11 lines for 4 periods.
All 4 UI elements (Zone table, Zone chart, Power graph, and Best efforts table) share the same row on my display.
My suggestion would be to show the power curve and best efforts table always on a new row. And also a new row for the two decoupling charts.
Ps: I’m very new to intervals.uci, and impressed with it’s capabilities
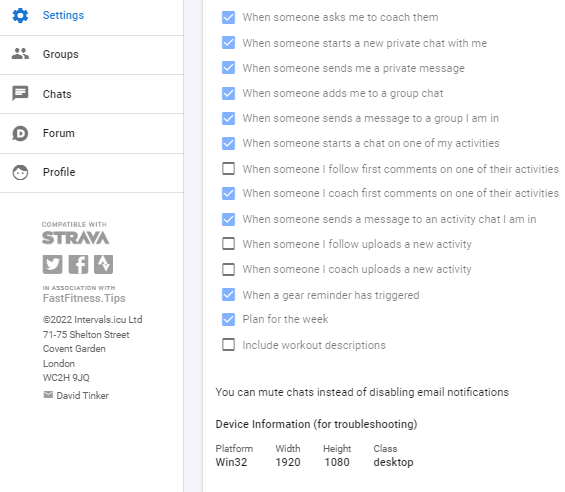
I was able to replicate the problem when changing display settings from 1536x864 (125% zoom, recommended) to 1920 x 1080 (100% zoom).
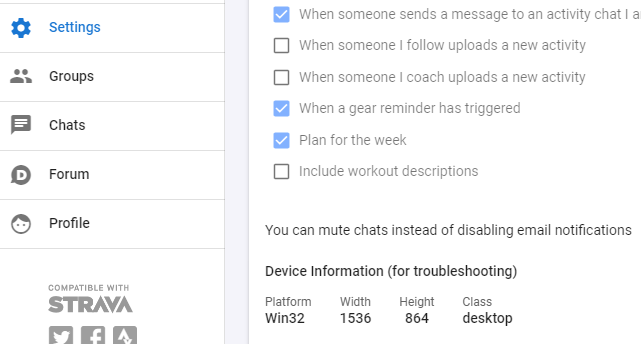
Firefox
Chrome on desktop.

Thanks everyone. I have fixed this. Will deploy Sat AM (GMT+2).
@david always #1. ![]()