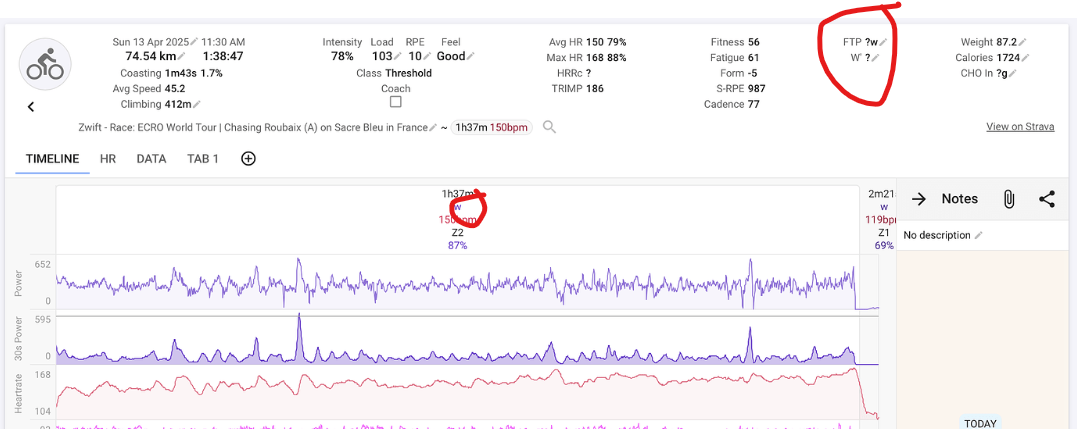
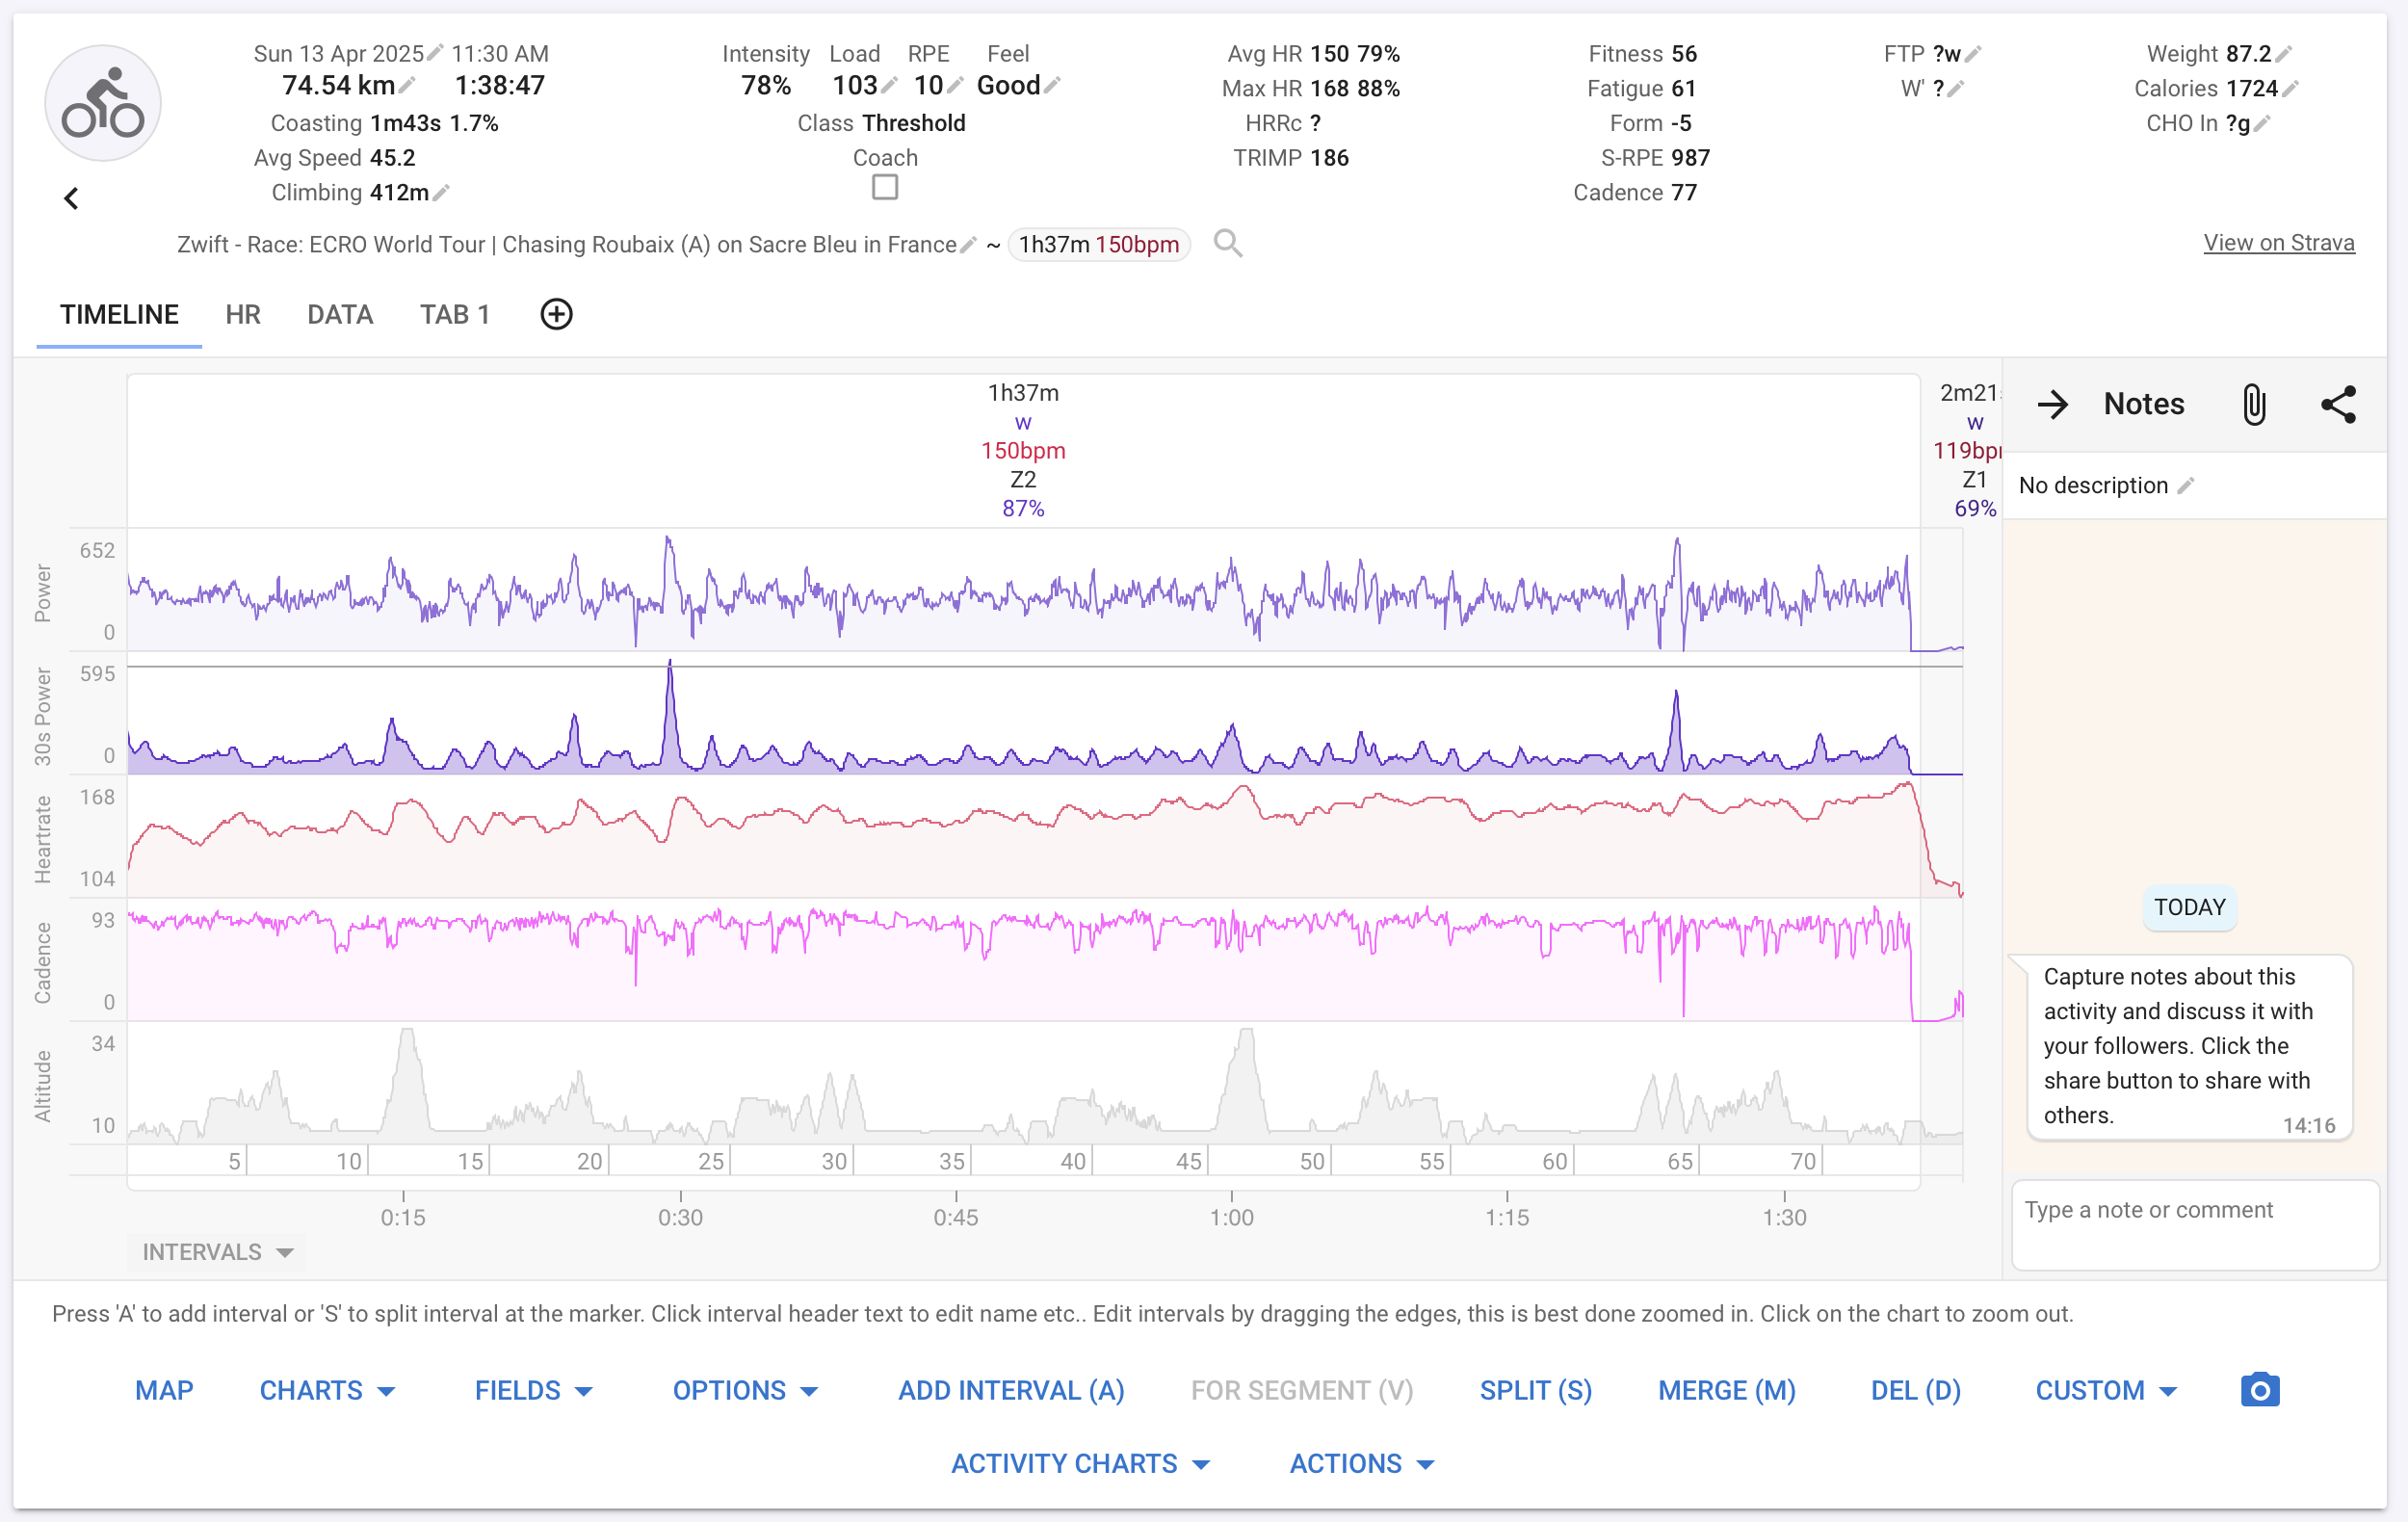
Hey. For some reason my power graph is not updating after yesterday’s insane ECRO Chasing Tour ride on Zwift. I completely annihilated my previous best power output for 1 hour and 1,5 hours, but the graph doesn’t reflect this. What gives? Could it be because Intervals get the data from Strava? Something API-related?
I’m going to take a wild guess here because you’re not giving us much info to work with…
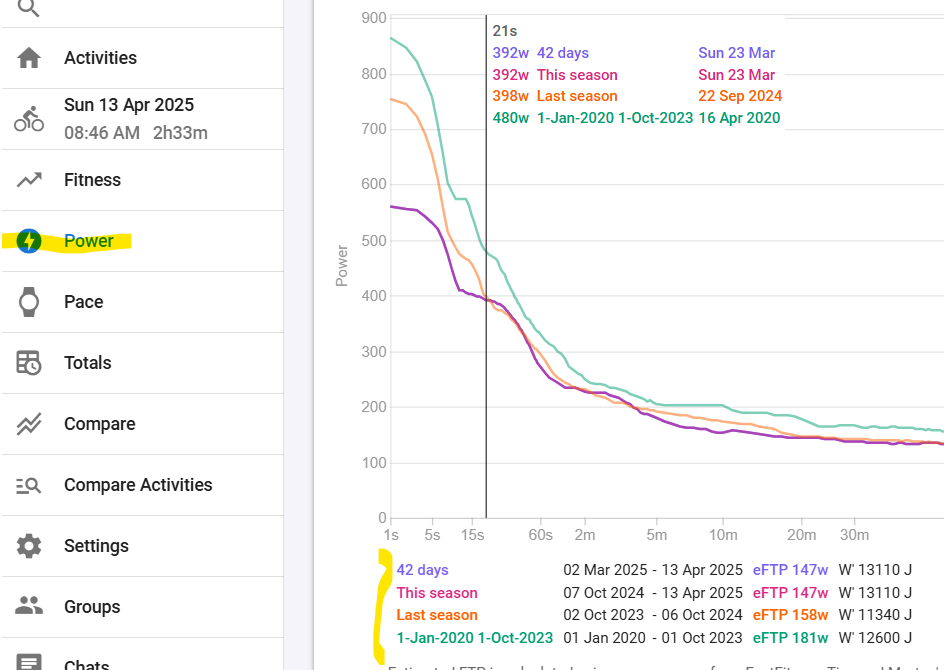
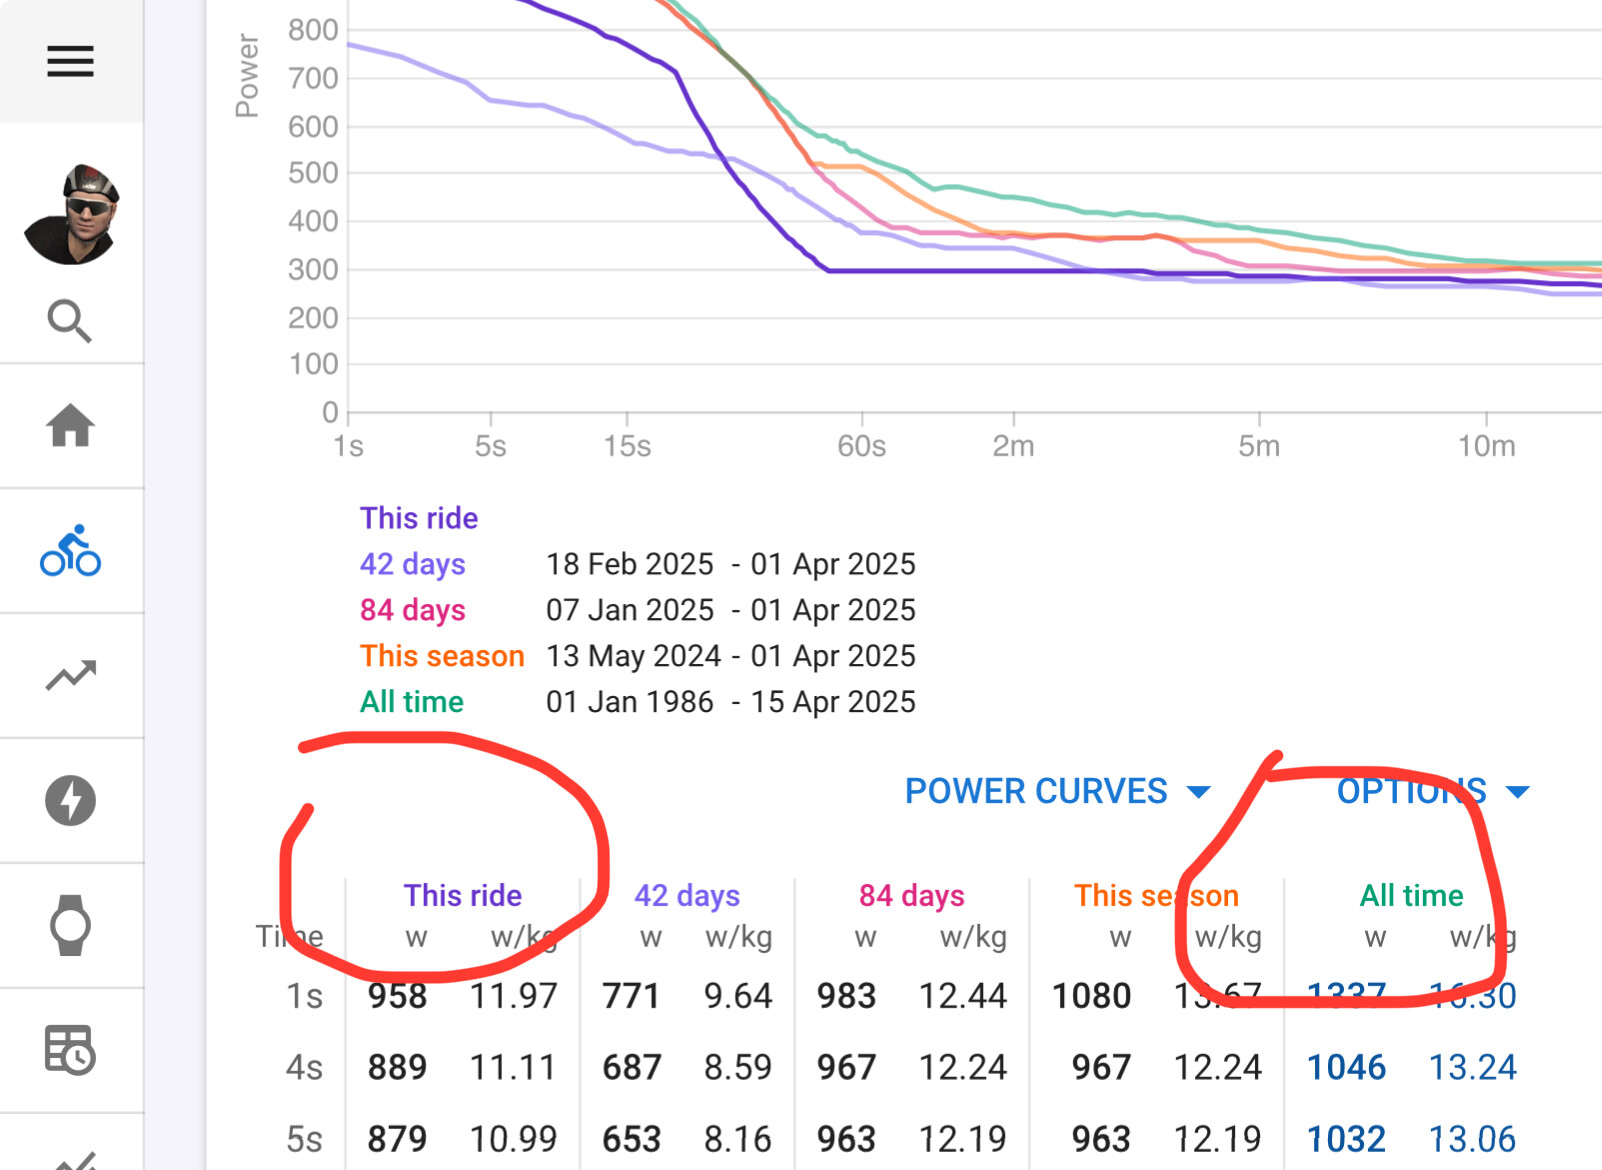
I think that you’re looking at the Activity Power tab and there, the ATB results are not directly in the curve because that would make it impossible to compare todays ride with former results. You have ‘This Ride’ and then a number of curves for other date regions/seasons.
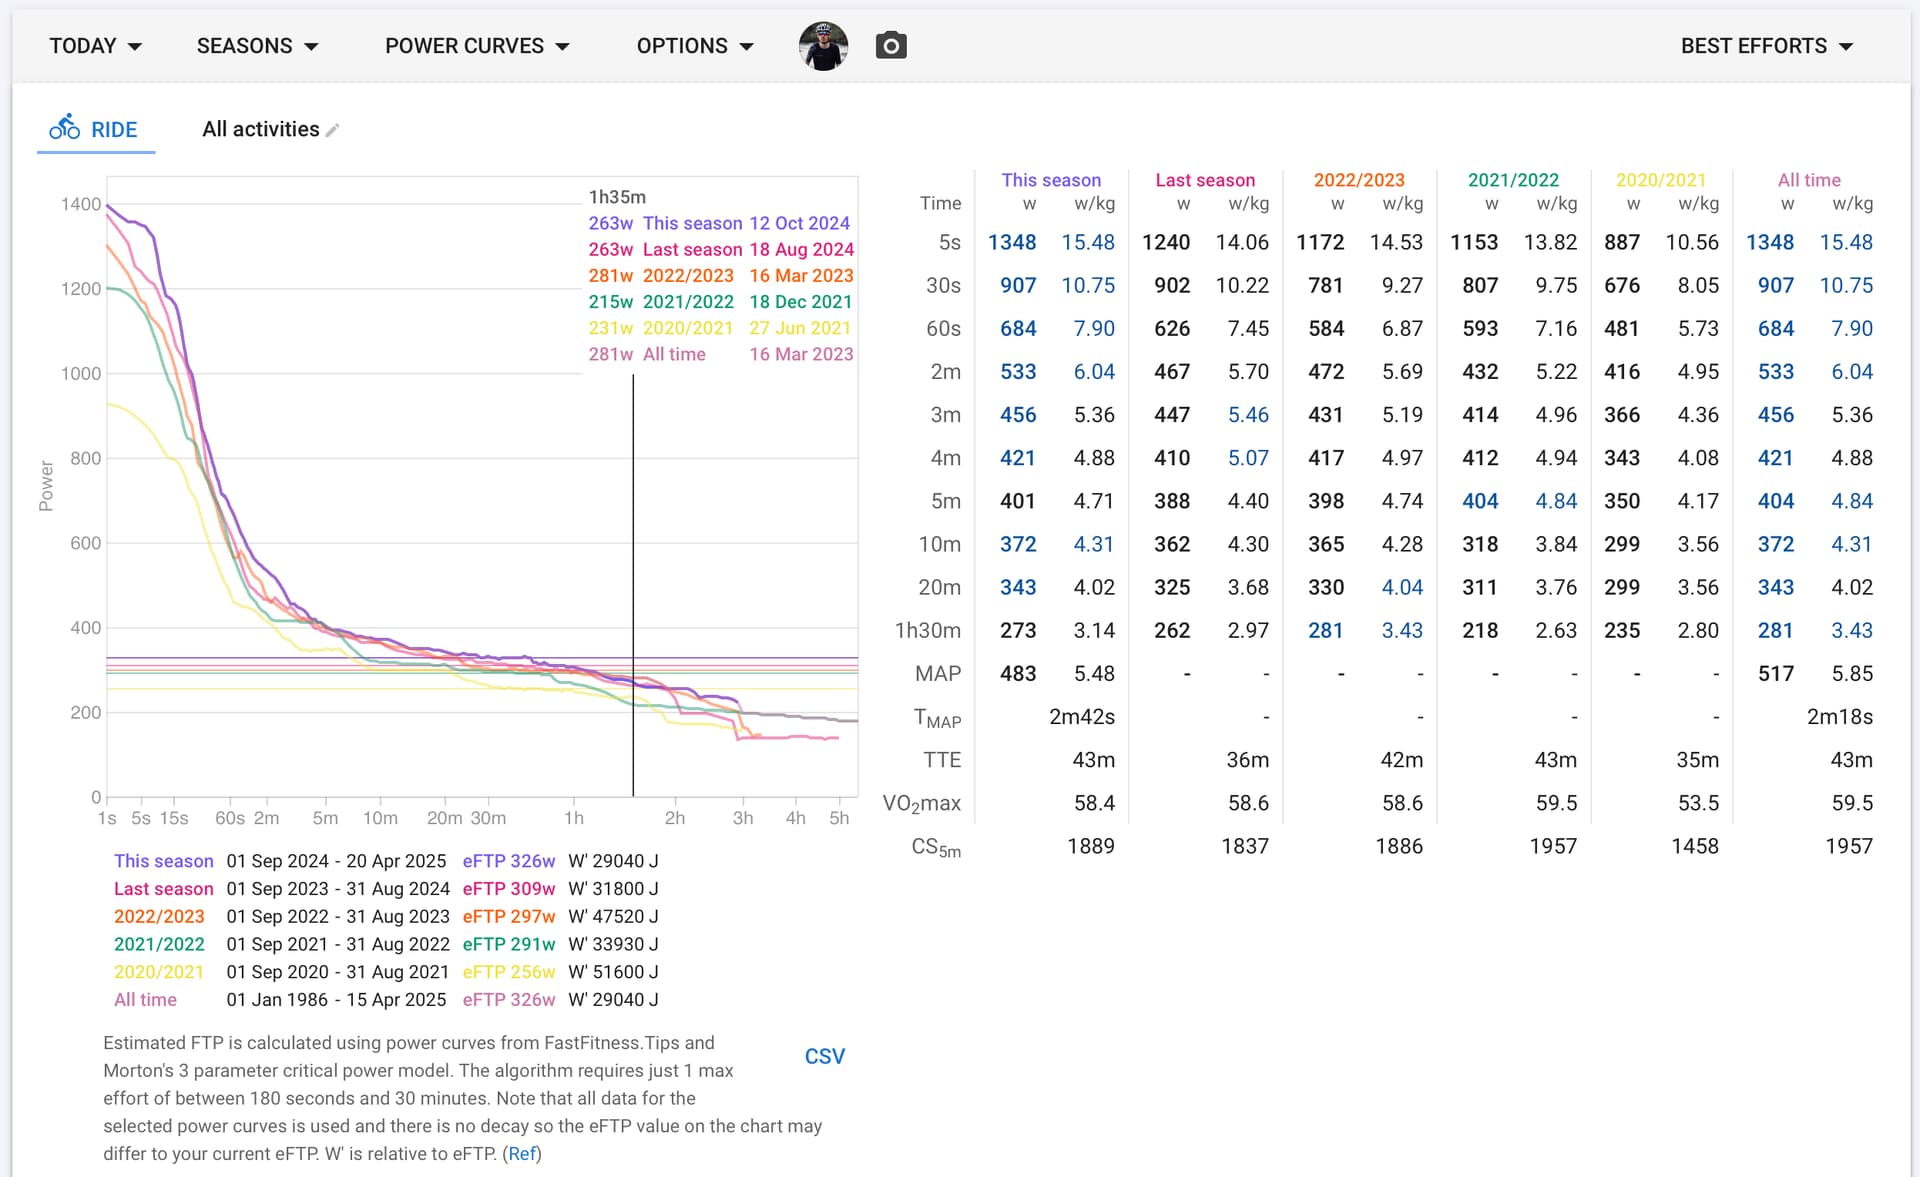
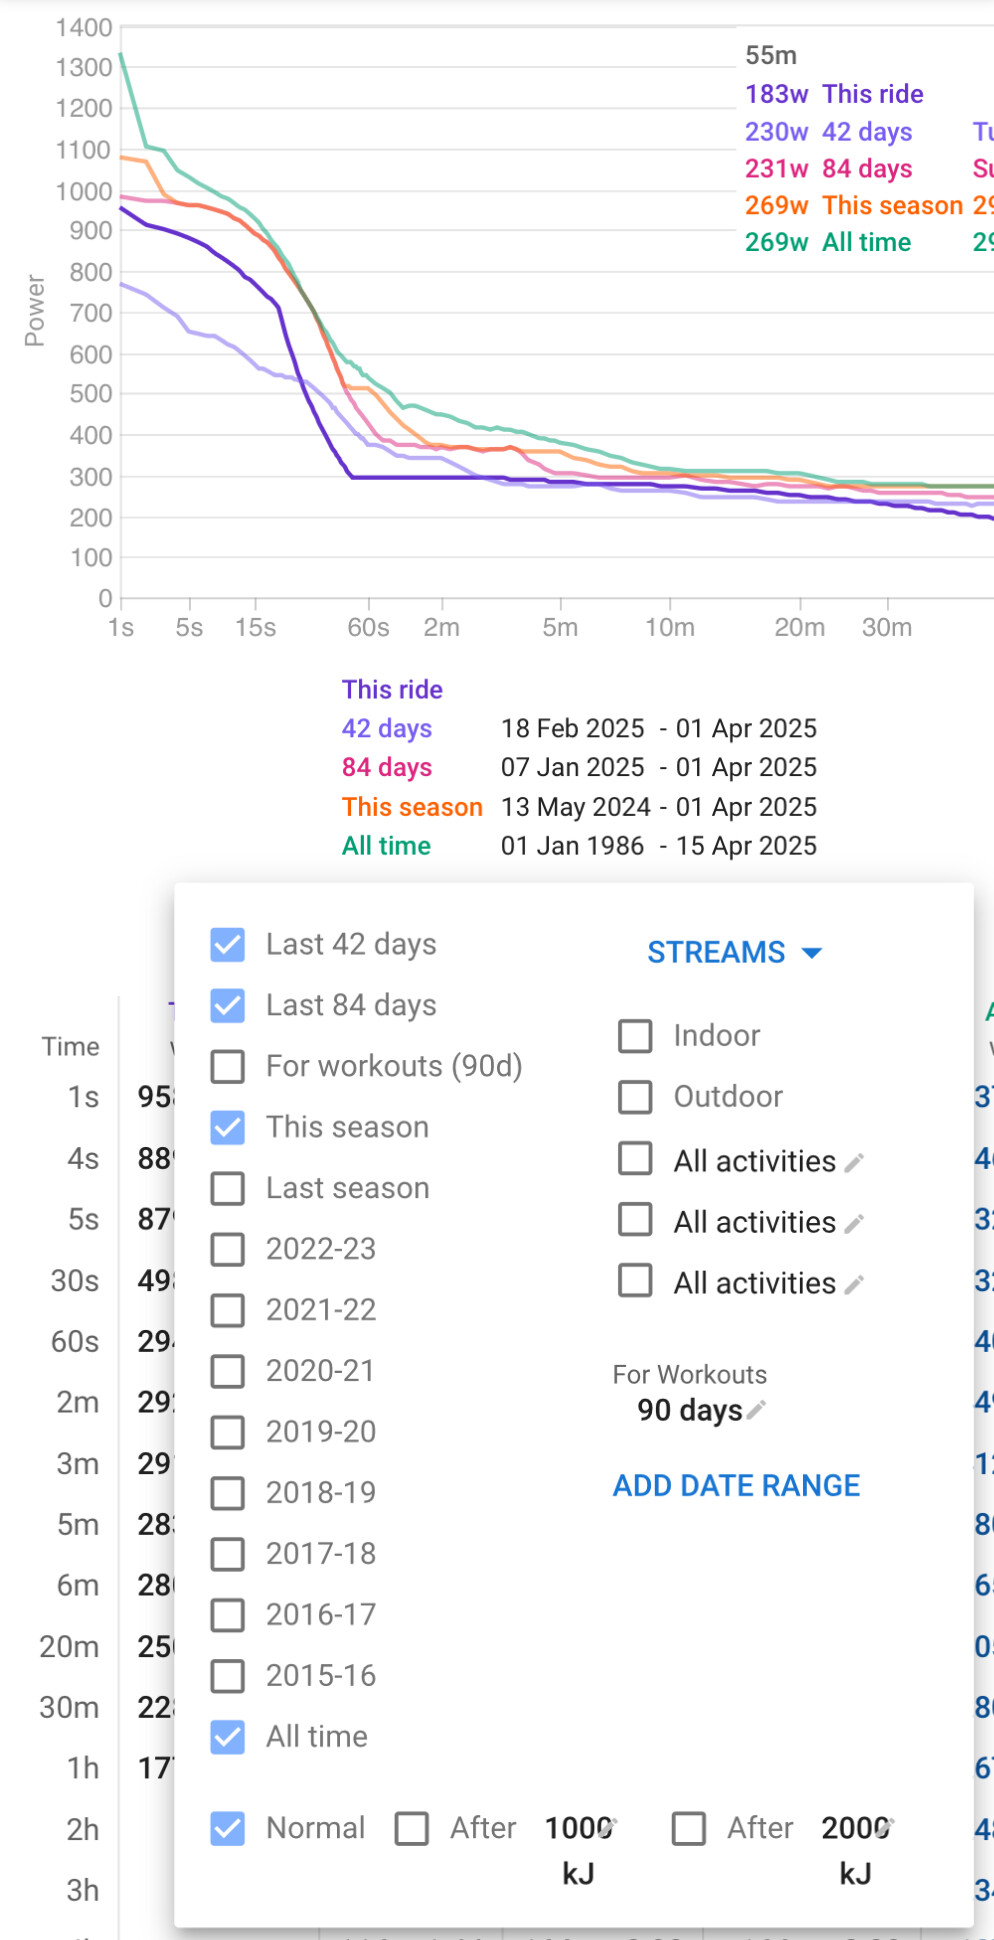
If you go on the overall Power Page, all available results are in the general PDC curve.
Activity Power tab

Versus Overall Power page
Thanks for your quick reply and for taking the time to reply at all!
So here are screen shots of the activity (where I did 300 + watts for 90+ minutes) and my power graph for all activities.
Is this statement perhaps true for activities on the same day?
My PBs show on the activity chart, based on the curves I’ve selected. In this case it’s 42 days, 84 days, this season and all time. I can choose from all the options available and create more.
As @MedTechCD suggests, share the screen view you’re looking at, so those that understand can assist you.
Thank you! I have posted screen dumps above.