Hi, since Polarized training is a thing, I hoped you could add an overview of the time spend in their zones when you click on the “Details” of the weekly overview volume.
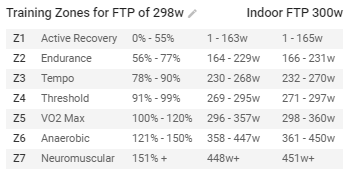
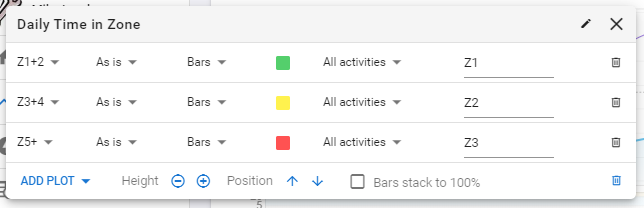
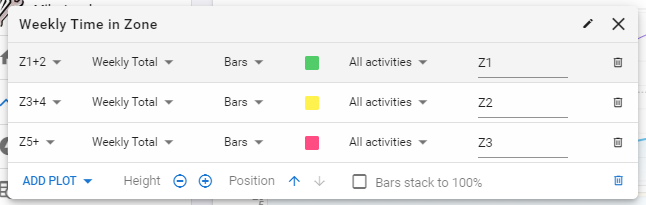
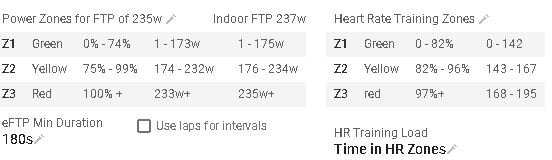
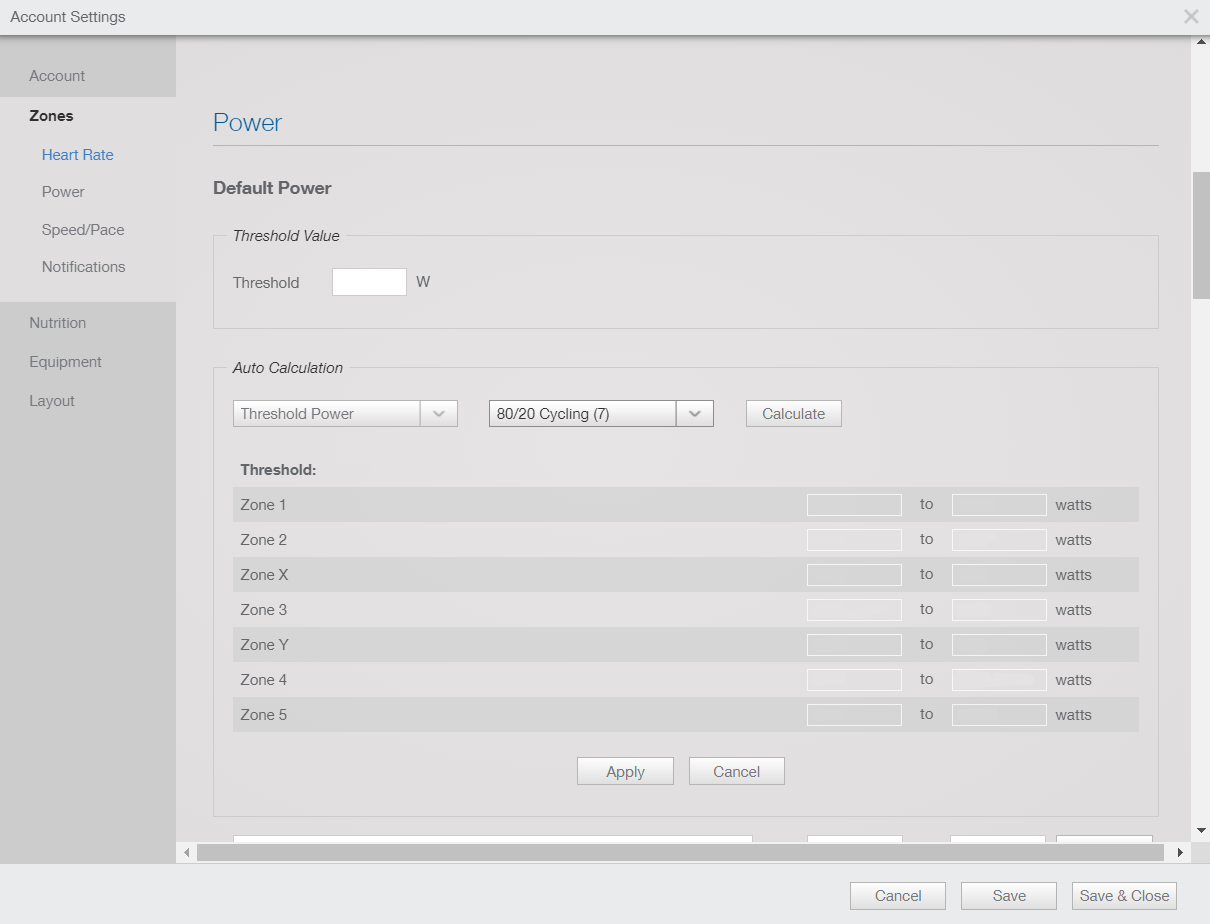
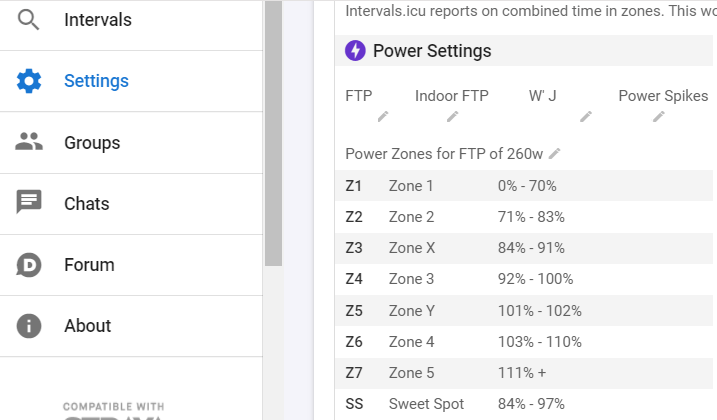
Currently I redefined Z4 and Z5 and to have their border on 100% FTP and then try to quickly do the sums in my head (Combining Z1 + Z2 as Z1, Z3 and Z4 as Z3 and Z5 and higher as Zone3) but it would be nice to just being able to see it.
Scientifically the border between Z1 and Z2 is LT1 defined as < than 2 mM* blood lactate and it seems like coaches estimate this being around 77% of FTP or 75% Max HR and the border between Z2 and Z3 being the lactate threshold or LT2, which can be estimated as 90% of your 20min power.
The science might be a little of topic, but I find it interesting that one can only sustain LT2 for 30-40 (depending on fitness level) minutes yet it is defined as less than FTP (which is estimated at 95% of FTP20 everywhere). And in scientific articles they use a 30min test to estimate MLSS (time which you can sustain LT2).
Obviously this messes up the traditional zones and makes the Totals page a bit pointless although I would argue that the way that works is incorrect for identifying polarized anyway, as it’s based on zones that don’t have the boundaries in the correct place.
It would be quite nice if these zones were supported separately.
Thanks for the information, this helps already.
With this method one cannot see the exact percentage, like you can see in the Weekly “detail” view, or am I missing something?
Edit: I see when you look at the shape of the weekly “detail” view, it combines the zones to tell you what type of training you did that week. I thought those were static images previously.
But I agree that it would be nice to be able to define zones separately.
David forgive me if I’m overlooking something obvious but I have searched with no luck. On the totals page, I see the time in zones with the classification foregrounded depending on the totals for any given week. Is it possible, however, to manually select another classification? So if I would like to see the polarised zone totals for any given week for example without manually resetting my zones.
Many thanks for all the hard work you put it, it’s a fantastic resource.
Tx. I am not quite sure what you mean by “polarised zone totals”? You can click the weekly totals on the calendar page to get the time in zones popup for that week.
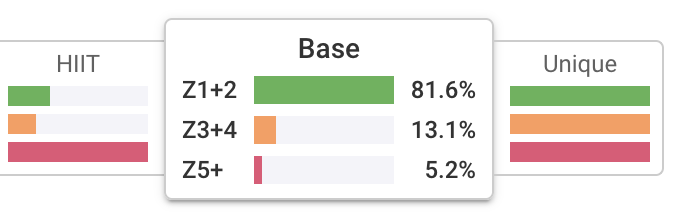
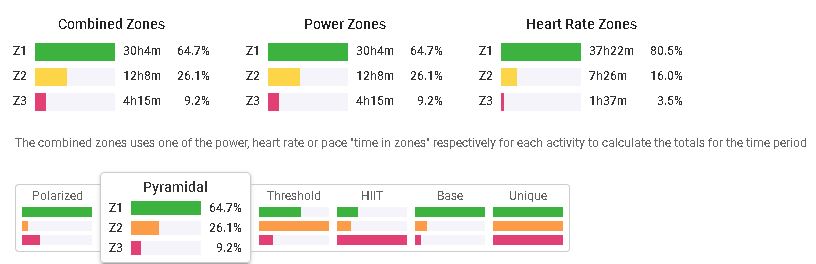
Apologies I’m not being clear. So at the moment if you click on my weekly totals in the Calendar page I get the pop up box and in that box ‘Unique’ is highlighted at bottom right as that is the training metric that most closely matches my efforts so far this week. I was wondering the following: is it possible for me to click on for example, the ‘Polarised’ box at bottom left and see what my aggregate time in the zones defined by that model might be?
I understand that the system chooses and displays the system that most closely matches any given week’s training but it would be super interesting to be able to choose all of the systems (Polarised, Pyramidal, Threshold, HIIT etc) to see how time in zones stacked up in each one.
I think I understand the issue. The 3 zone breakdown with percentages in the popup box that most closely matches your training for the week is your real data for that week not just an example.
So those are my real numbers from last week. I have been a bit lazy and unmotivated seeing as the races that were coming up have all just been (understandably) cancelled
How do you classify when there are activities with and without power.
Nonetheless sum times also do not match each other and with Totals.
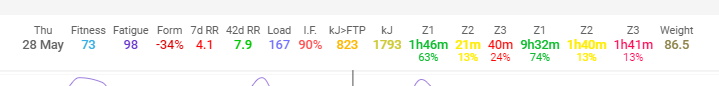
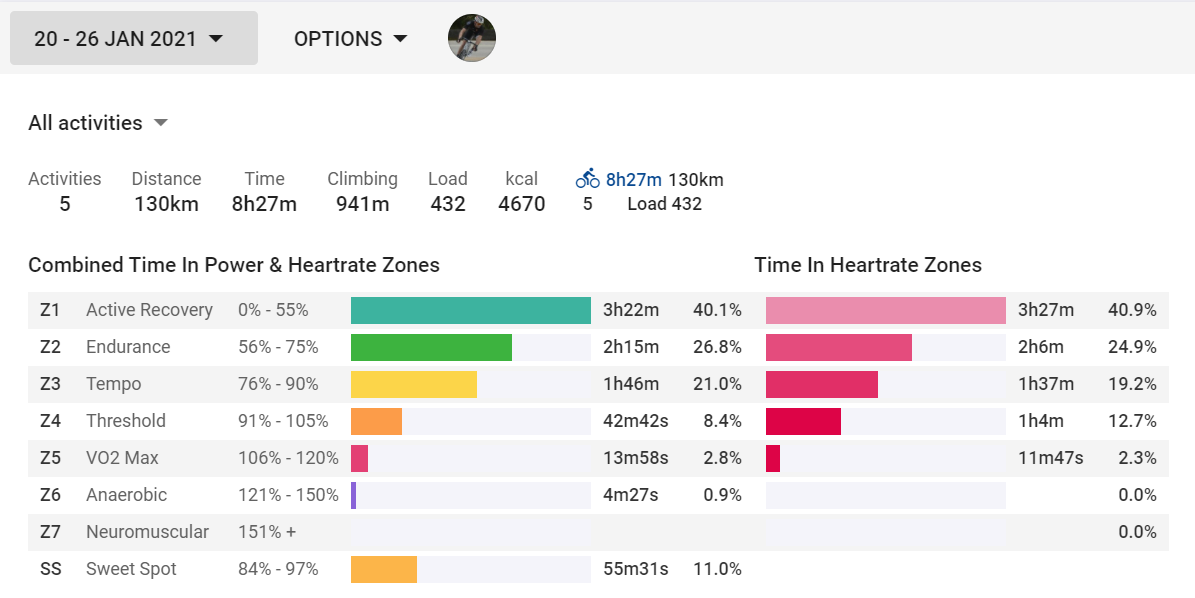
Total Time in the header shows 8h27m
Combined Time In Power & Heartrate Zones sum = 08h24m07s
Time In Heartrate Zones sum = 08h25m47s
Very small difference but is about only a week,
If an activity has power and HR then the time in power zones is used for the combined totals. If it has only HR then the HR zone times are used for the combined totals.
As for the difference maybe some data points didn’t have HR data due to missed samples or dropouts etc?
shouldn’t them be in Z1? Power and HR starts with 0%, or not?
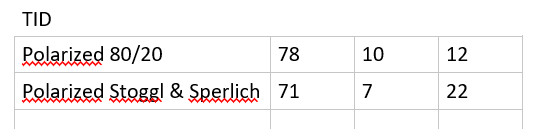
Would you share the chart (percentages in each zone) you use to classify totals (as polarized, base, unique, etc)?
I thought there were fixed numbers and not only bigger ou smaller comparisons.
The objective was to try to maximize TID on the chosen method.
Like I’ve got from fastfitness.tip only that one by one …