Started using DFA A1 for around 6 months already, thought of tracking my improvements by plotting my power at DFA A1 at 0.75 and 0.5 and comparing them over time. Any idea on how i can plot this on custom charts at fitness tab?
1 Like
interested about the same here. I’ve been using AlphaHRV to collect data for my run & trail run activities but I feel I don’t make much use of the data.
Could you explain, maybe with an example activity, what you already have and what you want to track? Is it one value per activity, or more and want to have an average of them and so on.
@Roy_Nilo_Badong @ohmax @R_S1 R2Tom Try my Activity Chart: with DFA1 vs Power over time.
HRV Threshold Estimator *
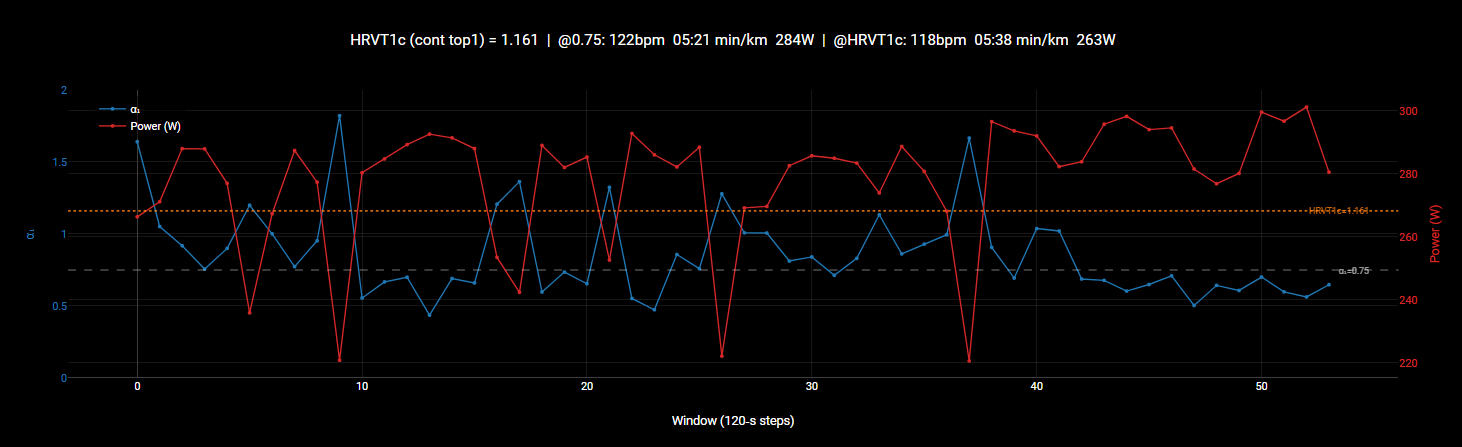
=== DFA α₁ + Power Analysis (HRVT1c with continuous top1 mean) ===
Config: window=120s, sdnn_threshold=10ms, topN=1
Parsed 7410 RR intervals.
After artifact correction: 7384 intervals.
Computed features for 28 windows.
Features (first 5 rows):
timestamp    heartrate   rmssd   sdnn    alpha1     speed        power
0             110.02     8.80    51.61   1.636985   11.68395     270.04
1             118.13     6.00     9.76   0.712633    8.96523     264.47
2             115.69     5.91     9.77   1.190066   10.16157     262.05
3             116.53     6.66    12.06   0.972715   10.37802     269.94
4             117.23     7.19     8.54   0.862204   10.27827     271.01
Continuous top 1 windows: indices 7–7
  α₁ values: 1.749
Mean of continuous top 1 (max early): 1.749
HRVT1c (custom midpoint): 1.125 (midpoint between 1.749 and 0.5)
Mean Alpha 1: 1.11
Mean Alpha 1, filtered based on sdnn < 10: 0.79
Heart Rate at 0.75: 124 bpm
Speed at 0.75: 11.07 km/h
Pace at 0.75: 05:25 min/km
Power at 0.75: 287 watts
Heart Rate at HRVT1c (1.125): 113 bpm
Speed at HRVT1c (1.125): 9.38 km/h
Pace at HRVT1c (1.125): 06:24 min/km
Power at HRVT1c (1.125): 254 watts
Regression equations (filtered data):
  HR  = -28.239 * α₁ + 144.8
  Speed = -4.511 * α₁ + 14.45 km/h
  Power = -87.21 * α₁ + 352 W
1 Like
I can’t seem to find your chart on the activity charts.
1 Like
Thank you for noticing. Corrected. And Open Source
Tried it, thanks! is it possible to plot it on fitness charts over time?
No, the objective of this chart is to emulate the now defunct https://github.com/marcoalt/Colab/blob/main/hrv_thresholds.ipynb Marco Altini Open Source Colab app
I tried but for an activity it says “No HRV data” while there are definitively AlphaHRV data logged.
You have to enable hrv recording in your watch.
To enable HRV recording on a Garmin watch, you need to pair a compatible chest strap and then go to Settings > System > Data Recording > Log HRV = On. For older models, you may need to download a specific file to enable this feature
1 Like
Thanks I didn’t know my Garmin FR955 could do that I went into the settings and enabled HRV recording. What will be the difference compared to using AlphaHRV ConnectIQ app?
The Garmin enabled function logs RR intervals for each beat. This allows detection of early/late/skipped/multi beats etc…
Alpha HRV logs dfa-a1, derived from RR intervals but isn’t logging the RR-intervals themselves.
1 Like
AlphaHRV ConnectIQ app works great. For a 6’ step graded exercise test, results should be similar, with my estimator giving slightly more conservative results.
My script is fully configurable, feel free to test different settings
1 Like
Thanks next month prior to my Marathon prep plan starting, I’m going to do 2 CP tests : 3’ and 20’ as per Stryd plan so ‘all out’ effort, not graded exercise. I will be interesting data to extract and process 
1 Like
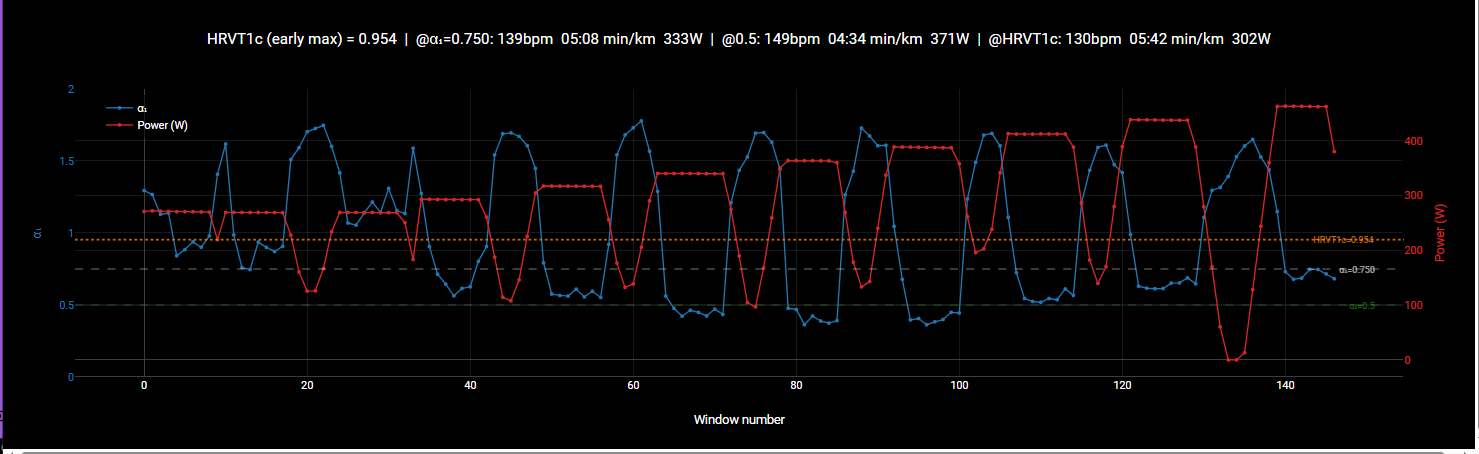
1. Purpose & Background
The HRVT1c is an individualized threshold derived from heart rate variability (DFA‑a1) that closely agrees with the gas‑exchange threshold (GET).
-
The standard threshold (DFA‑a1 = 0.75) often overestimates the true aerobic threshold.
-
HRVT1c corrects this by using the midpoint between each individual’s maximal DFA‑a1 during the early portion of the test and 0.5.
This protocol will help you obtain a clean, reliable DFA‑a1 signal to calculate your HRVT1c and the corresponding heart rate, power, and pace.
2. Equipment Required
| Item | Purpose |
|---|---|
| Heart rate monitor with R‑R recording | Chest strap (e.g., Polar H10, Garmin HRM‑Pro) – optical sensors are not reliable. |
| Power meter (cycling) or treadmill with speed control (running) | To measure and control intensity. |
| Head unit or watch | To record the activity (must include R‑R intervals). |
| Intervals.icu account | To run the DFA‑a1 script and analyse the results. |
3. Pre‑test Preparation
3.1 Determine Your Starting Speed
The starting speed should be well below your expected aerobic threshold. Use your VDOT score (from a recent race) to estimate a safe, easy starting pace.
Step 1: Find Your VDOT
-
If you have a recent race time (e.g., 5K, 10K), use an online VDOT calculator to get your VDOT score.
-
Or use Tiago Seabra VDOT Activity Field.
-
Example: A 20‑minute 5K gives a VDOT of approximately 48.
Step 2: Calculate Starting Speed
-
vVO₂max (km/h) = (VDOT – 3.5) × 0.3
-
Starting speed = 50% of vVO₂max
Note: The table below rounds the calculated starting speed to the nearest whole km/h so it can be set directly on a standard treadmill.
| VDOT | vVO₂max (km/h) | Starting Speed (km/h) – rounded for treadmill |
|---|---|---|
| 35 | 9.45 | 5 |
| 38 | 10.35 | 5 |
| 40 | 10.95 | 6 |
| 42 | 11.55 | 6 |
| 45 | 12.45 | 6 |
| 48 | 13.35 | 7 |
| 50 | 13.95 | 7 |
| 52 | 14.55 | 7 |
| 55 | 15.45 | 8 |
| 58 | 16.35 | 8 |
| 60 | 16.95 | 9 |
| 62 | 17.55 | 9 |
| 65 | 18.45 | 9 |
For cycling, if you have a power meter, use 30–35% of FTP as the starting power (e.g., FTP 300 W → start at 90 W).
3.2 General Preparations
-
Hydrate well before the test.
-
Avoid heavy meals, caffeine, and alcohol for 2‑4 hours beforehand.
-
Avoid strenuous exercise in the 24‑48 hours before the test.
-
Wear appropriate clothing and ensure the chest strap is properly positioned (use conductive gel if needed).
4. Step‑by‑Step Test Execution
Stage Durations: 5 Minutes Each
-
Warm‑up (5–10 minutes)
-
Perform a very light jog or pedal at a low intensity (e.g., 50 W or 6 km/h).
-
Do not include this in the recorded activity – stop recording before starting the test, or start recording only when the test begins.
-
-
Start the activity on your head unit (ensure R‑R recording is enabled).
-
Begin Stage 1 at your calculated starting speed/power.
-
Maintain a constant speed or power for exactly 6 minutes.
-
Keep your running form or cadence consistent.
-
Do not force Respiration
-
-
Increase intensity for the next stage:
-
Running: increase speed by 0.5–1.0 km/h (prefer 1.0).
-
Cycling: increase power by 15–25 W (or 5–10% of FTP).
-
-
Repeat each stage for 6 minutes until you can no longer maintain the required speed/power (volitional exhaustion).
-
Cool‑down: After exhaustion, perform a light cool‑down for 5–10 minutes. Stop recording.
Example Protocol (Running, VDOT 50)
| Stage | Speed (km/h) | Duration |
|---|---|---|
| 1 | 7.0 | 6 min |
| 2 | 8.0 | 6 min |
| 3 | 9.0 | 6 min |
| 4 | 10.0 | 6 min |
| 5 | 11.0 | 6 min |
| 6 | 12.0 | 6 min |
| 7 | 13.0 | 6 min (likely exhaustion) |
5. Analysis with the Intervals.icu Activity Chart
5.1 Prepare the Script
- Ensure the
CONFIGsettings match your test:
javascript
WINDOW_SECONDS: 120,          // 2‑minute windows (validated)
OVERLAP_SECONDS: 80,         // 115→ step = 5s (matches the study (if memory allows))
EARLY_RAMP_ABSOLUTE_SECONDS: 300,   // first 5 minutes = early ramp
USE_FILTERED_REGRESSION: true,
ARTIFACT_PERCENT_MAX: 5,
DFA_A1_THRESHOLD: 0.75,       // standard threshold (optional)
USE_HRVT2: true,              // anaerobic threshold
USE_HRVT1C: true,             // custom threshold
5.2 Run the Script
-
Click Run (or refresh the page).
-
The script will output:
-
HRVT1c (e.g.,
1.09). -
Threshold estimates at α₁=0.75, α₁=0.5, and HRVT1c for HR, speed, and power.
-
The pace at the threshold.
-
5.3 Example Output
text
HRVT1c (early‑ramp max, 3‑SD filtered): 1.099 (max early = 1.52)
At HRVT1c (1.099): HR 123 bpm, Speed 10.24 km/h, Pace 05:51 min/km, Power 278 W
6. Compare with Other Methods
Now, to validate and contextualize your HRVT1c, compare it with the following surrogate thresholds (if available).
| Method | What to Compare | How to Interpret |
|---|---|---|
| FTP (Cycling) | Compare power at HRVT1c with FTP. Typically, HRVT1c power is 50‑65% of FTP for trained cyclists. | If your HRVT1c power is much lower (<45% FTP), you may have started too high or have poor cardiovascular fitness. If it’s >70%, your FTP might be underestimated. |
| SmO₂ (NIRS) | If you have a SmO₂ profile from the same test, look for the first breakpoint (desaturation onset). Compare the power/HR at that breakpoint with your HRVT1c values. | Good agreement suggests both methods capture similar physiological events. Disagreement may reflect local muscle vs systemic differences. |
| Tymeware VitalPro | If you have used Tymeware’s VT1 estimate, compare the speed, HR, power at VT1 with your speed, HR, power at HRVT1c. | These two methods both estimate ventilatory threshold; if they differ by more than ±5 bpm, consider which is more consistent with your perceived effort and training response. |
| alphaHRV datafield | If you have analysed the same activity with alphaHRV, compare the threshold HR, power values. | Differences may arise from artifact correction, detrending, or window settings. |
| Lactate or Gas‑Exchange (if you have lab data) | This is the gold standard – compare directly. | Your HRVT1c should be within the normal variability of lab testing. If not, check data quality or consider individual differences. |
How to perform the comparison:
-
For each method, note the speed, HR and power at the estimated threshold.
-
Plot them side‑by‑side in Intervals.icu (or in a spreadsheet) and calculate differences.
-
Look for systematic bias (all methods over/under) or random variability.
7. Interpreting the Results
-
HRVT1c (e.g., 1.099) – use the associated speed, HR, and power to define your zone 2 / endurance training intensity.
-
HRVT2 (α₁=0.5) – corresponds to the anaerobic threshold (respiratory compensation point).
-
HRVT1s (α₁=0.75) – will likely overestimate the threshold; treat with caution.
Apply to Your Training
-
Endurance sessions: Stay below the speed/power/HR at HRVT1c.
-
Threshold sessions: Work at or slightly above HRVT1c.
-
Interval sessions: Use HRVT2 as an upper boundary.
8. Tips & Troubleshooting
| Issue | Solution |
|---|---|
| No R‑R data | Ensure your chest strap is properly paired and recording R‑R intervals. |
| High artifact % (>5%) | Check belt placement, use conductive gel, or reduce ARTIFACT_PERCENT_MAX to 3%. |
| Too few windows | Increase OVERLAP_SECONDS to 115 (5s step) to get more data points. (if memory allows) |
| Unrealistic threshold | Verify your starting speed – if it’s already near the threshold, the early‑ramp max may be affected. Adjust EARLY_RAMP_ABSOLUTE_SECONDS to exclude the first stage if it was not a true “easy” start. |
| Fatigue | Ensure you are well‑rested before the test. |
9. References
-
Rogers, B., Fleitas‑Paniagua, P. R., & Murias, J. M. (2024). Improving the Agreement Between the First Heart‑Rate‑Variability Threshold and the Gas‑Exchange Threshold. International Journal of Sports Physiology and Performance, *19*(12), 1434.
-
Jack Daniels’ VDOT system (for starting speed calculation).
1 Like
Nice chart. Plotted it on an old step test I did in 2022. This give me LT1 at 201W. At 0.75W it would gave me 220W.
I now have a lactate meter and I can do some more testing again to see where all values will align for the moment.
1 Like
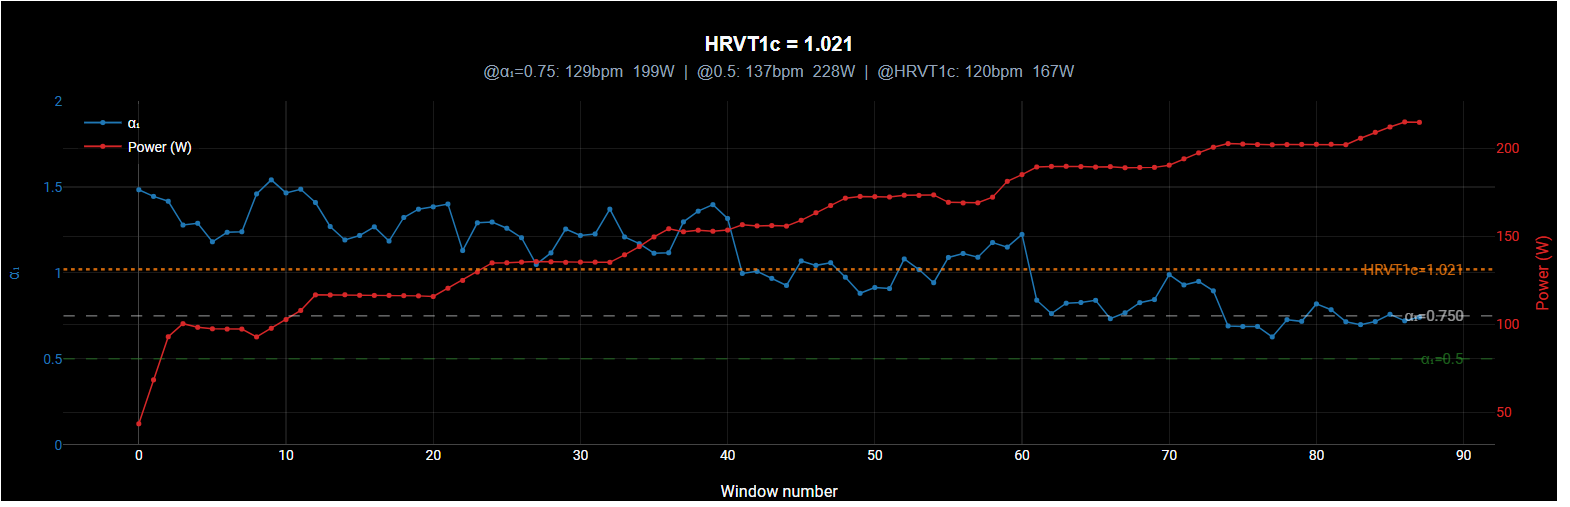
Test done. 0.75 gives me 199W treshold. New method gives me 167W. Hmm, does not know what to think about this? 199W (runalyze says 205w) seems more in line with past values (power and hr). 120bpm is normal endurance for me and 69% of FTP (test done on TT bike where FTP is around 240W. Road bike around 260W). Now in a few days will conduct lactate test to see where the numbers match (or not)
1 Like
for best results try to increase OVERLAP_SECONDS by 5
var CONFIG = {
OVERLAP_SECONDS: 90,