There has been a recent study showing that the biggest injury predictor in running is exceeding your longest run in the past 30 days by more than 10 %. Is it possible to plot this ration with the current functionality of Interavals.icu?
If yes, can someone help me with what I need to do? I know how to plot the 30d max distance. I know how to plot the each run’s distance. But I have now idea how I would add a plot with the ratio of the two.
As far as I am aware, it’s not possible to use activity level data together with other activities, and display these at activity level. By that I mean you can’t (currently) search for the max distance in activities to bring the value back into the day’s activity.
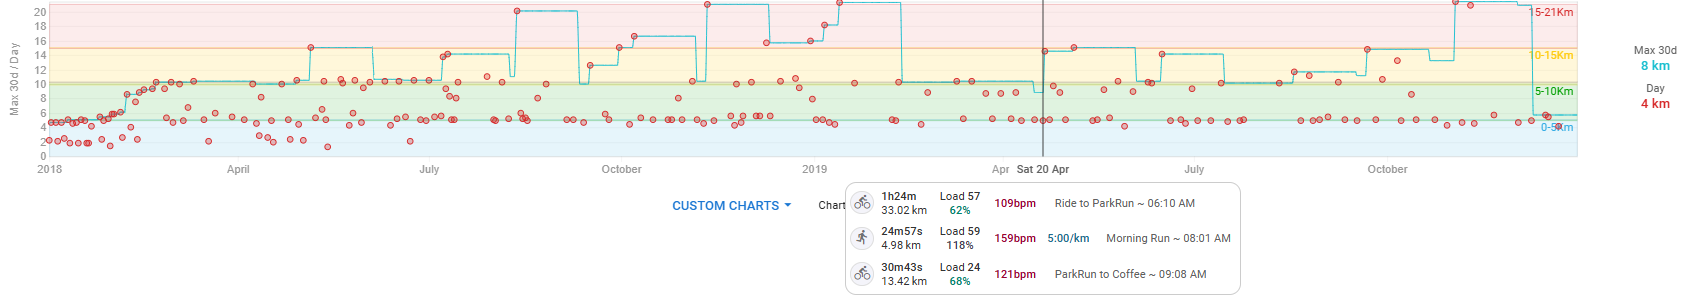
It is possible to graph the two, eg. show the max 30d distance and the daily distances and filter on running activities only (see my chart below).
Ok, good to know it’s not possible, so I can stop trying to find a way. I’ve also managed to get the same chart drawn as you, albeit not as pretty. Thanks for the reply.
I’ve actually done something similar in Intervals.icu when I was curious about my long run patterns, and it’s definitely possible. The trick is to use a custom chart with a derived series where you take each run’s distance and divide it by your 30 day max distance. I’m not a pro at formulas, but once I figured out where to plug it in under the “Custom” option it worked fine, and it’s been pretty useful to see when I’m pushing that 10% threshold. It takes a bit of fiddling the first time, but once set up it updates automatically as new runs get added.
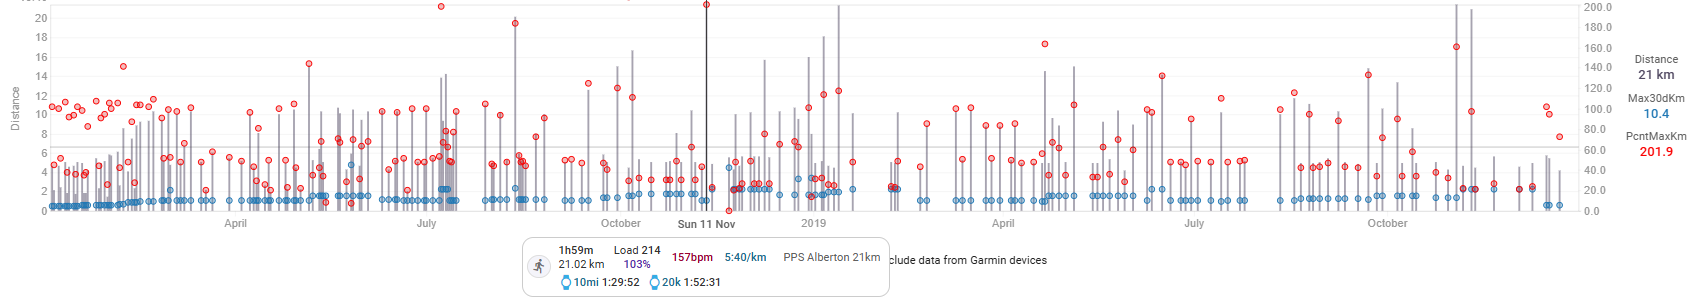
As I know how to get the activity data in Excel via the power data query, I was able to pull each “run” activity and calculate the two field (max distance in the last 30 days, and today’s activity as a % of that 30-day max). Running isn’t my primary sport, so I have a limited time period where I was running 3 times per week.
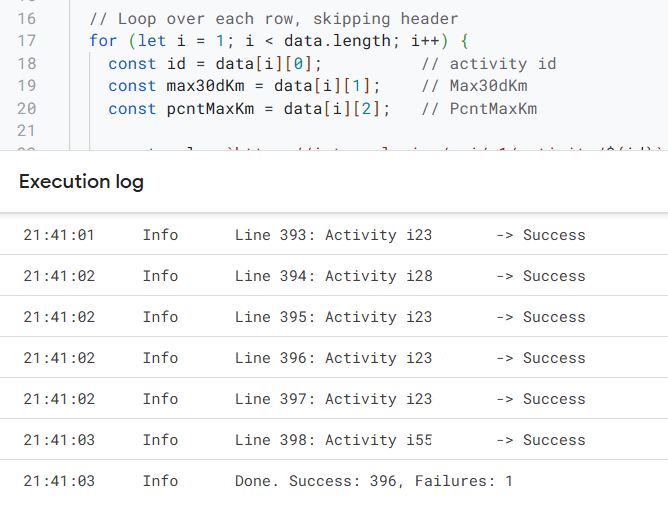
I tried a number of options, using the inter-webs for guidance, and eventually Google Sheets (and a script) could replicate the single activity update through the Swagger-UI. The Google Sheets script simply looped the request until all 297 of my activities (total runs) were updated.
It was fun/rewrding to get it working, as well as frustrating when it didn’t work. I tried using a VBA script in Excel (frustrating part), and had to settle for Google Sheets (frustrating to use compared to Excel).
Hey Gerald! Sorry for the late reply, life got in the way and then I forgot a bit about this. So if I understand correctly you’ve calculated the field data in excel and then pushed it to Intervals.icu via the http api?
I’ll check tomorrow; I can’t remember having only worked on it once.
=============== Edit: update
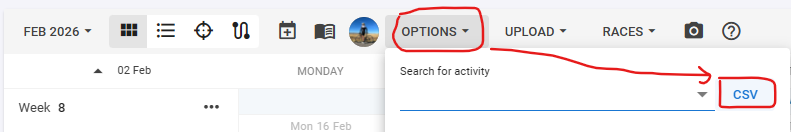
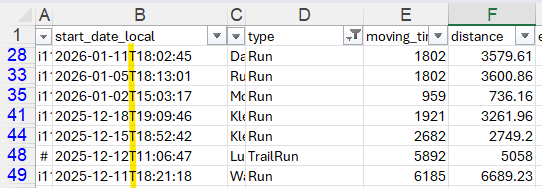
I downloaded the activities in csv format
Opened in Excel
Tab 1 = Paste download
Tab 2 = Convert (lots of formulae to workout the required values)
Tab 3 = list of all run activities, with lookups to the converted data
Copy the three columns in Excel and paste in Google sheets
Run the script to upload to Intervals
I recently became friends with Claude code (AI), but haven’t tried asking for assistance with a VBA script to do this in Excel. ChatGPT was incapable do successfully providing code for me on a few projects, but Claude Code was. I’ll see if I can get automation in Excel using Claude Code.
If you want the Excel file and Google sheets (file and script), let me know.
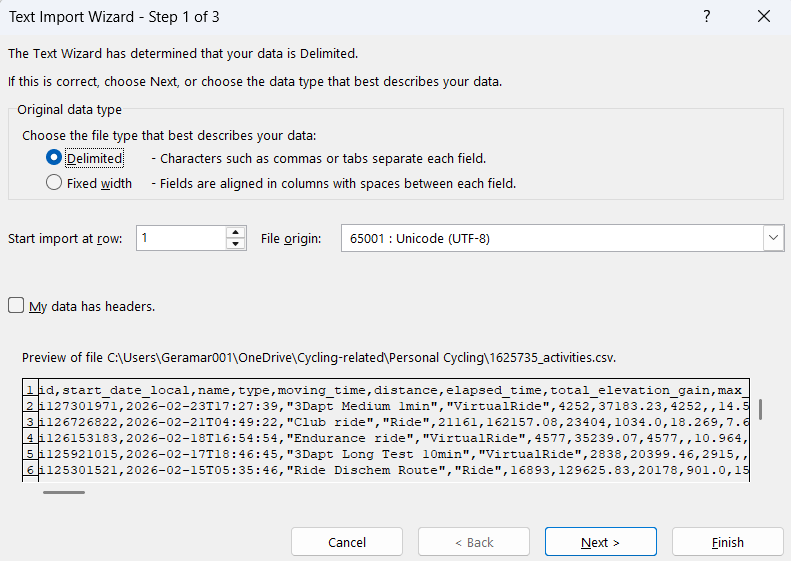
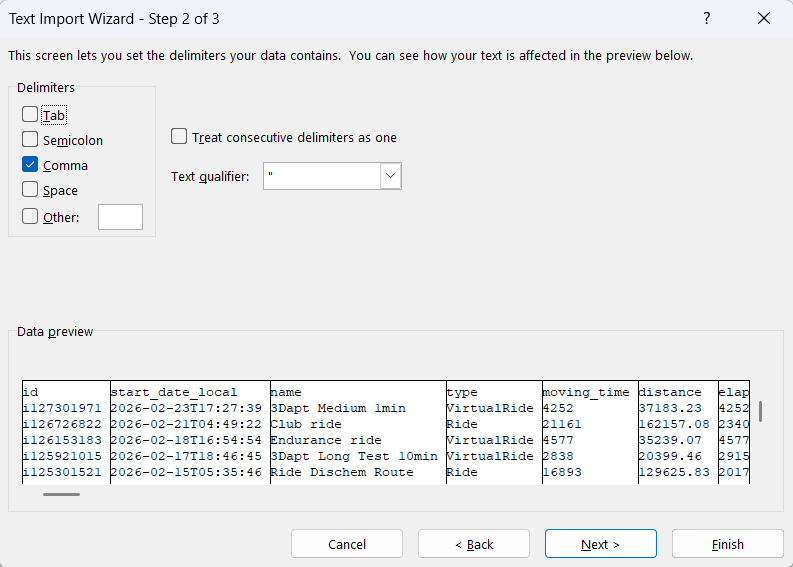
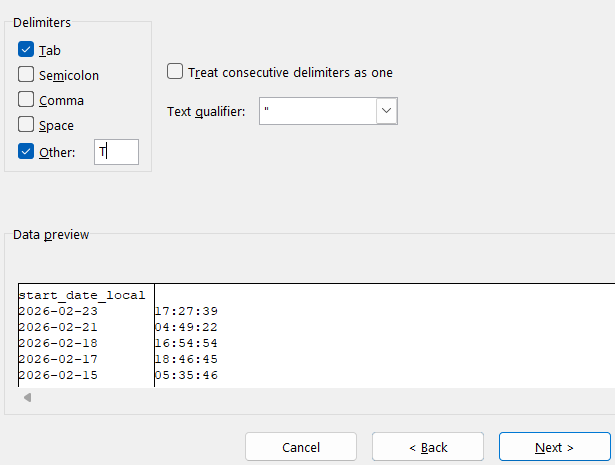
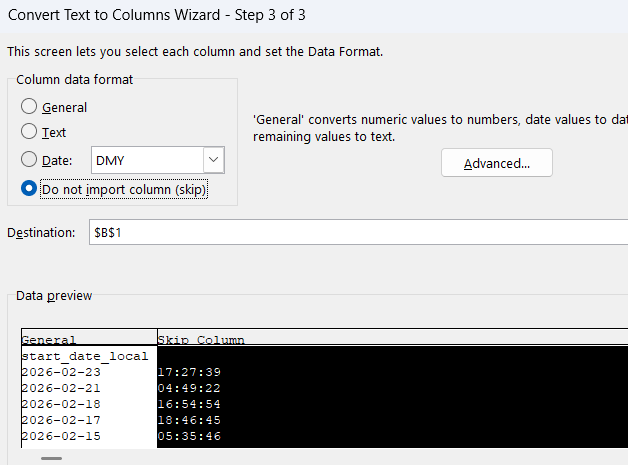
Open the .csv file in Excel, then use the text import wizard to convert to columns.
Claude code helped with the script in Excel, so it’s no longer required to use Google sheets.
I’ve excluded using the API to download the activities data, as the distance is not correct. One activity of 49m but shows 49905113 in the distance column, compared to 49.905113 in the csv download. I also notice that most of my activities start with the prefix “i”, and a few (9) don’t, which fail (404). I’ve manually updated these.
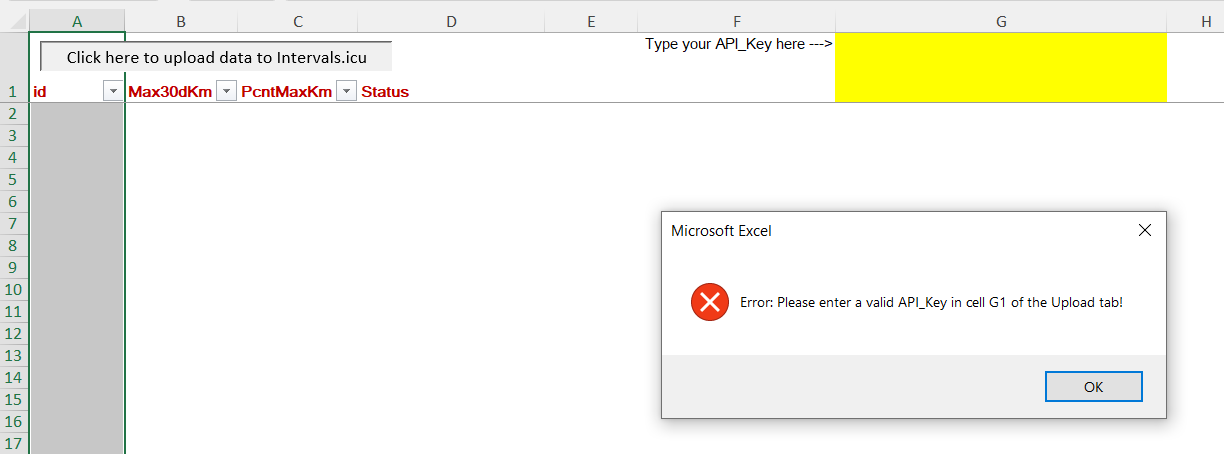
You would need to add your API_Key in cell G7 of the upload tab.
Filter on all run activities (outside, virtual, trail, etc.)
Copy from the CSV file to the Paste tab (including all headers)
Click the button on the Upload tab
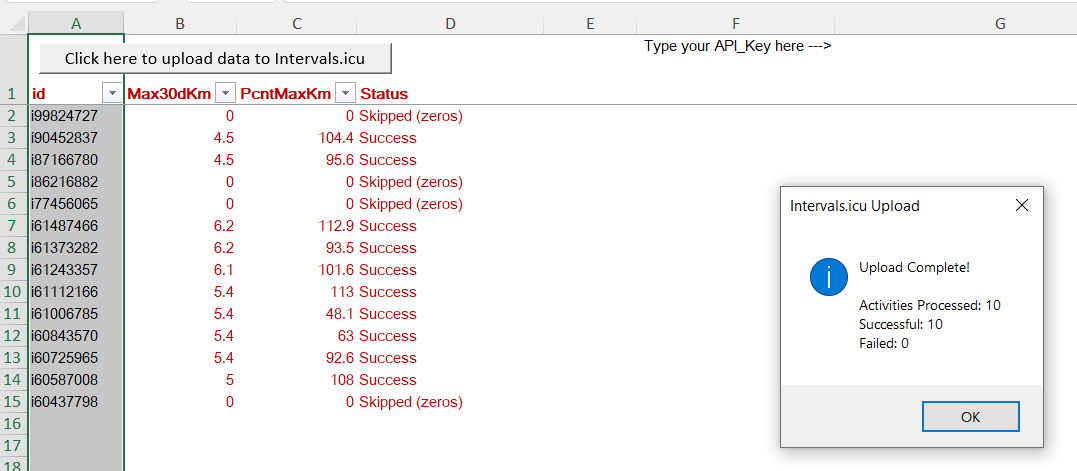
The process is slow, on purpose, to avoid overwhelming the API
Column D shows success or failed.
The excel file can be downloaded from my shared Google Drive.
It was a good learning experience for me, to use AI to assist with the coding.
The script is/was designed to upload in bulk, but can be used for single activities. The Excel file would calculate both values. Not sure how important having the most up to date value is, every day, but you could run this weekly.
I was looking at this post as you linked it on another thread. I downloaded the Excel file, but I’m not sure about the steps to take. And reading your last comment, I would actually be looking for a fully automated way to calculate both metrics within Intervals if possible.
Not possible at this time. The Excel files pulls data from the API, makes calculations that can’t be done within Intervals at this time, and then sends the results back through the API.
If you schedule a task on your computer to run daily, it is ‘semi-automated’ on the condition that your device runs (almost) daily.
As mentioned by @MedTechCD above, Intervals (currently) cannot use a script at activity level, and get data from other activities. I used three AI platforms to help code the script and (try) make it work as easy as possible.
I’m sorry but I really don’t understand the steps of copy paste CSV. Downloaded CSV data only being in single cell every row. Am I supposed to manually assign each Column (Date, Name, Type, etc.) to the same cell in Excel?