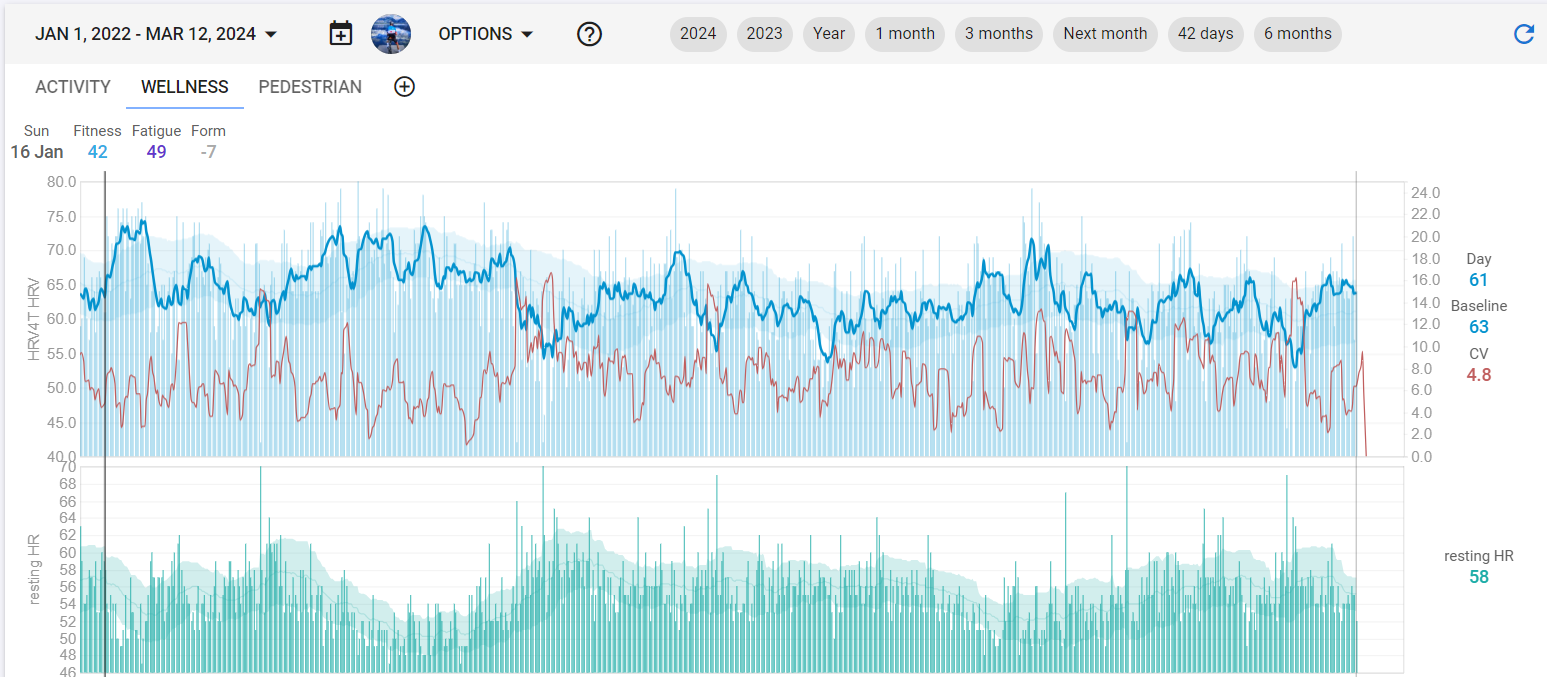
Are plots limited in how long of a date range they can display? I want to display every day’s HRV rating from 7/1/22 to present. I thought I configured the plot correctly and the label above shows the correct range but the plot itself and downloaded CSV only show 34 data points:

How do I fix this?