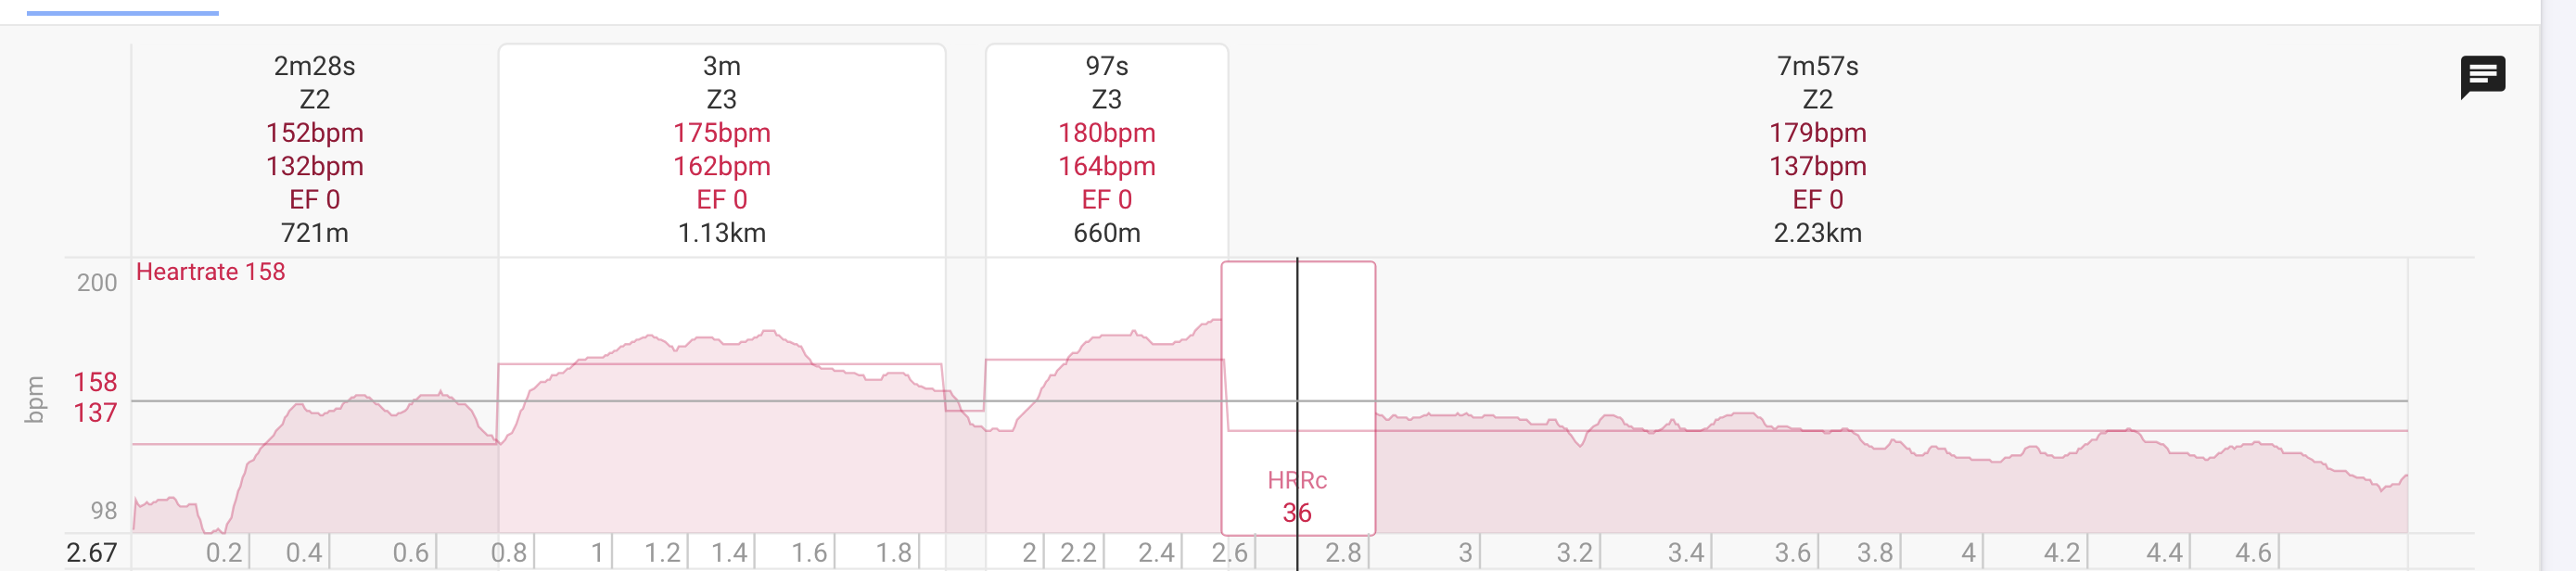
Hello, I noticed that IF I put the plot power OR hearthrate over the plot power (or hearthrate) “work interval trend”, this plot disappear under the HRRc plot, difficoult to explain but you can see it in the image. I noticed that if I put those plots “under” the work int trend it appears instead. Not primary bug but a little bit annoying.

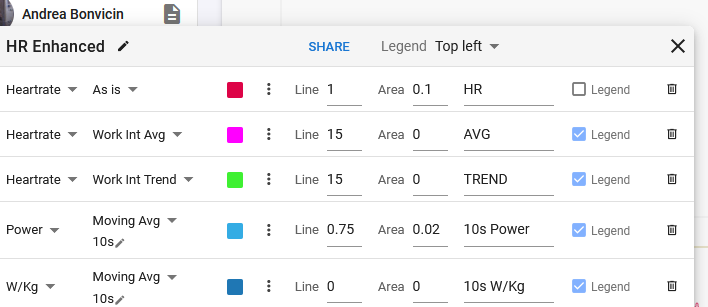
You can adjust area shading to make each transparent to a level that suits you.
Modify the Area parameter to apply transparency.
I know, thats not the problem. The plot just disappear no matter the area, you can see in the screenshot, it happens when you put the interval trend plot “under” in the plot order
Ah, understood. The HRRc detected range blocks any underlying chart and can’t be made transparent.
1 Like
Exactly. You can avoid this but putting the plot “Work int trend” first in the plot order, but then the legend at the left it’s called “work trend” or just “trend” and not HR or herthrate, you know. Yeah that’s not a primary issue I think but it triggers me a little bit when I’m watching graphics ahahahah
1 Like
I don’t know what the second line is, but does the problem remain when you delete it?
Or does the order of the two plots change the behaviour?
On my side, with only HR trace, it works correctly.
you can fix that by using rawHR instead of HR. That way, HRRC won’t appear in the chart at all.