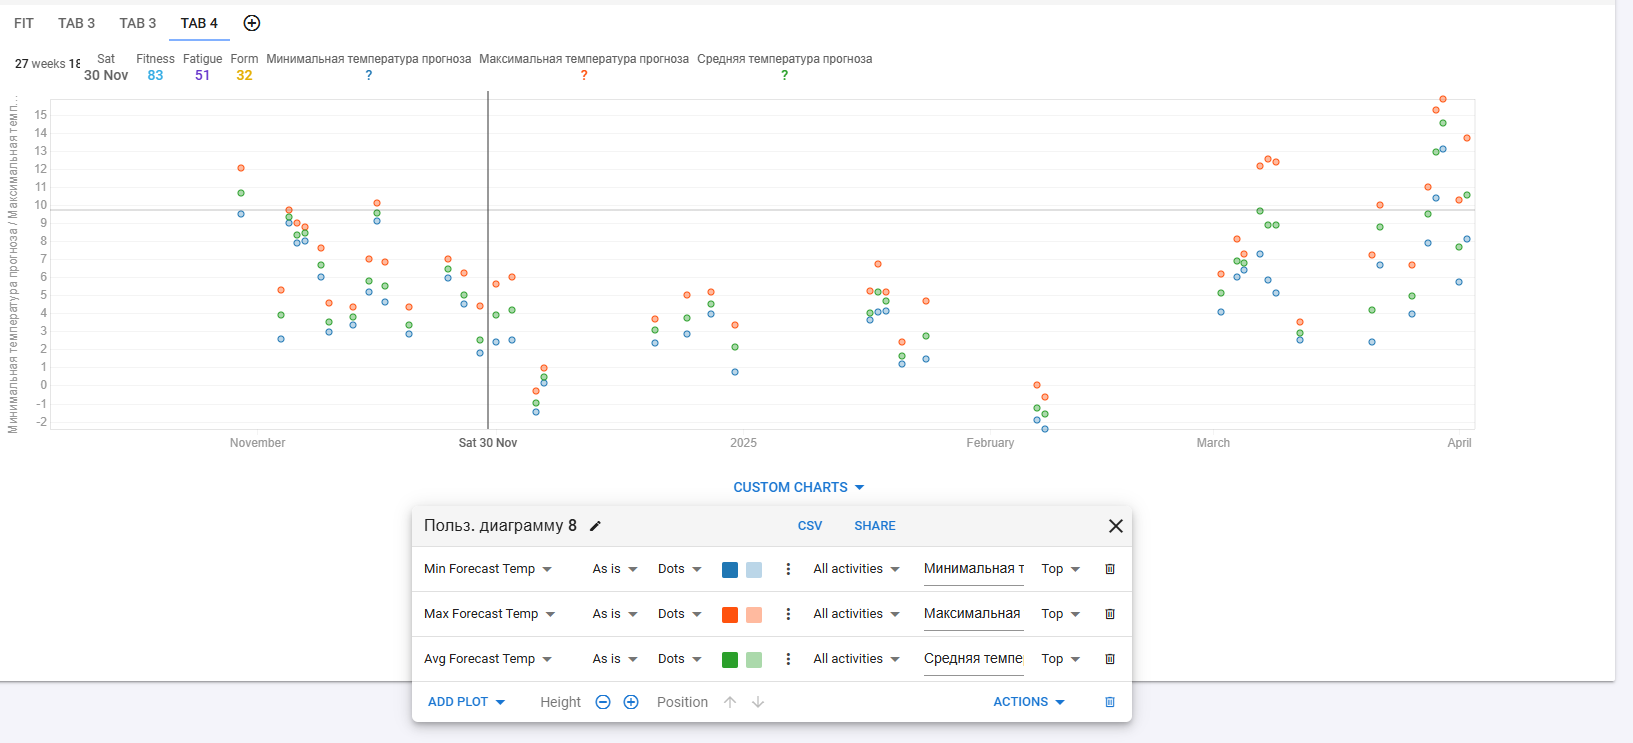
You can now plot weather forecast temperature data on the /fitness page. The average and max plots use the max from all activities matching the filter on the day. The min plots use the min from all activities matching the filter on the day.
Thanks again for implementing the weather forecast temperature feature — it’s a great addition and will certainly make it easier to analyze how weather conditions impact training. I’ve already started using it and I can already see how valuable it will be!
As I’ve been riding through the cooler months, I’ve noticed that temperature has a significant effect on my training. Specifically, when temperatures drop, especially in the fall, my CTL is still high, but fatigue sets in much quicker. I’m curious, how do your training sessions go when temperatures drop to around +10°C or lower? I’m especially interested in how others manage their training load and fatigue during these conditions.
It would be great to hear others’ thoughts on this, as I know riding in colder temperatures isn’t always the most popular choice! But I think it’s a topic worth exploring, especially for those of us who ride all year round.
I prefer colder temps (10C+ though). In summer, even starting at 6am, it is often over 30C and I am definitely more tired in the 4th hour of a 4 hour ride in those conditions.
Those metrics are displayed for every day on the calendar for present and future but only saved with an activity. If I’m not mistaking, you will only see history for days with an activity.
The weather data might not be present on those activities. When I added the feature I couldn’t retroactively compute it for all the existing activities (many millions). Try re-analyse one of those and see if the weather gets added.
I have many questions. What is the source for the forecast temp? Is it from a weather service that has accurate point forecasting around the world? Does Intervals base the forecast on the GPS point for the start of an activity? What about when there are multiple activities in a day in different locations (I do that quite a lot).
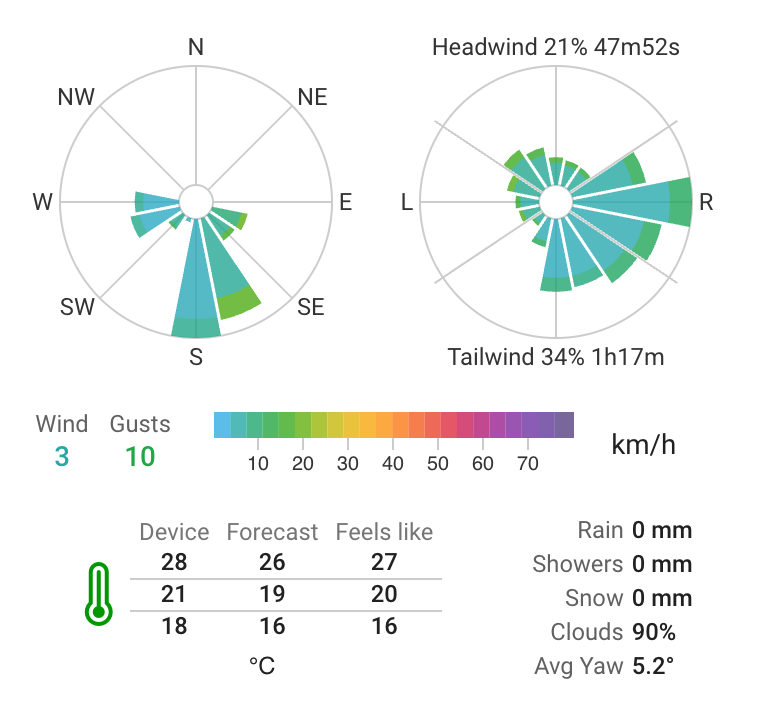
The other set of variables (max/min/average temperature) is taken from the device, correct? My Garmin Edge seems fairly accurate but my Garmin watch is not so accurate since it’s warmed by my wrist and clothing in the colder months.
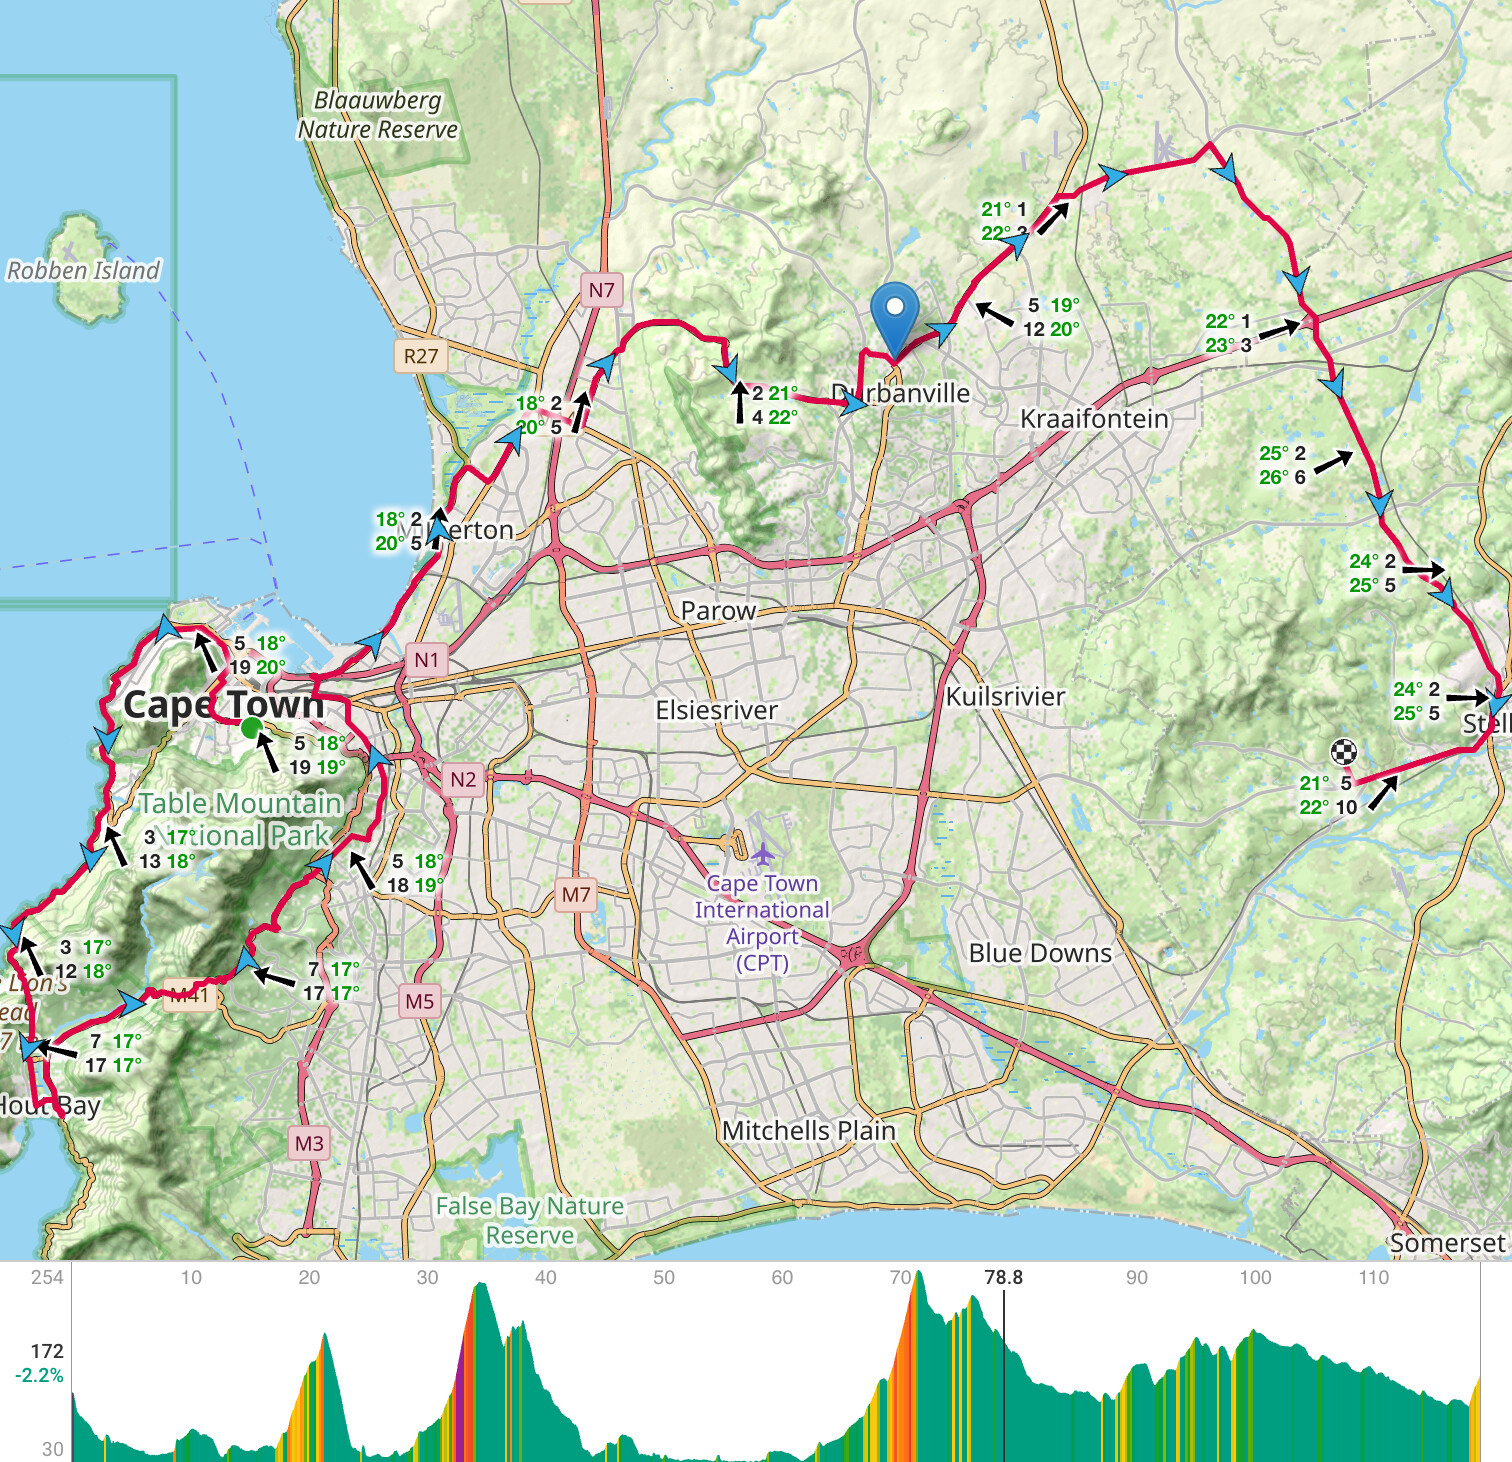
The weather data comes from Open-Meteo. Historical forecast data is requested for every 1.5km or so along the route and for a range of times. This might be interpolated by OM if the underlying weather model doesn’t have that resolution. If you mouse over the map with weather turned on you can see the forecast change along the route.
On the /fitness page the average and max plots use the max from all activities matching the filter on the day. The min plots use the min from all activities matching the filter on the day.