Hi,
Sorry if this already is possible or have been discussed before.
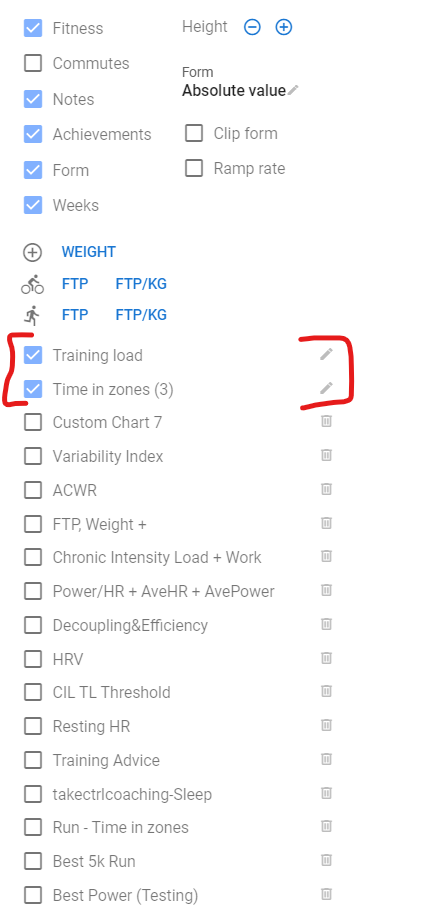
I would like to toggle on/off the planned time in zone, both HR and power, on the charts under the fitness graph.
When I have planned a workout at say x% FTP it somehow estimates a duration at HR zones, but it is completely off. The current week charts are useless until all planned workouts are done.
Are you referring to this chart?
Yes, that chart. (I’m also using a chart with power Z4+ and sweetspot. And one with HR4 and HR5+)
Maybe some filter can be used to exclude planned workouts? Then I can add two tabs, one included planned, and one excluding planned?
Do you want to hide it?
If yes, options, then untick the chart
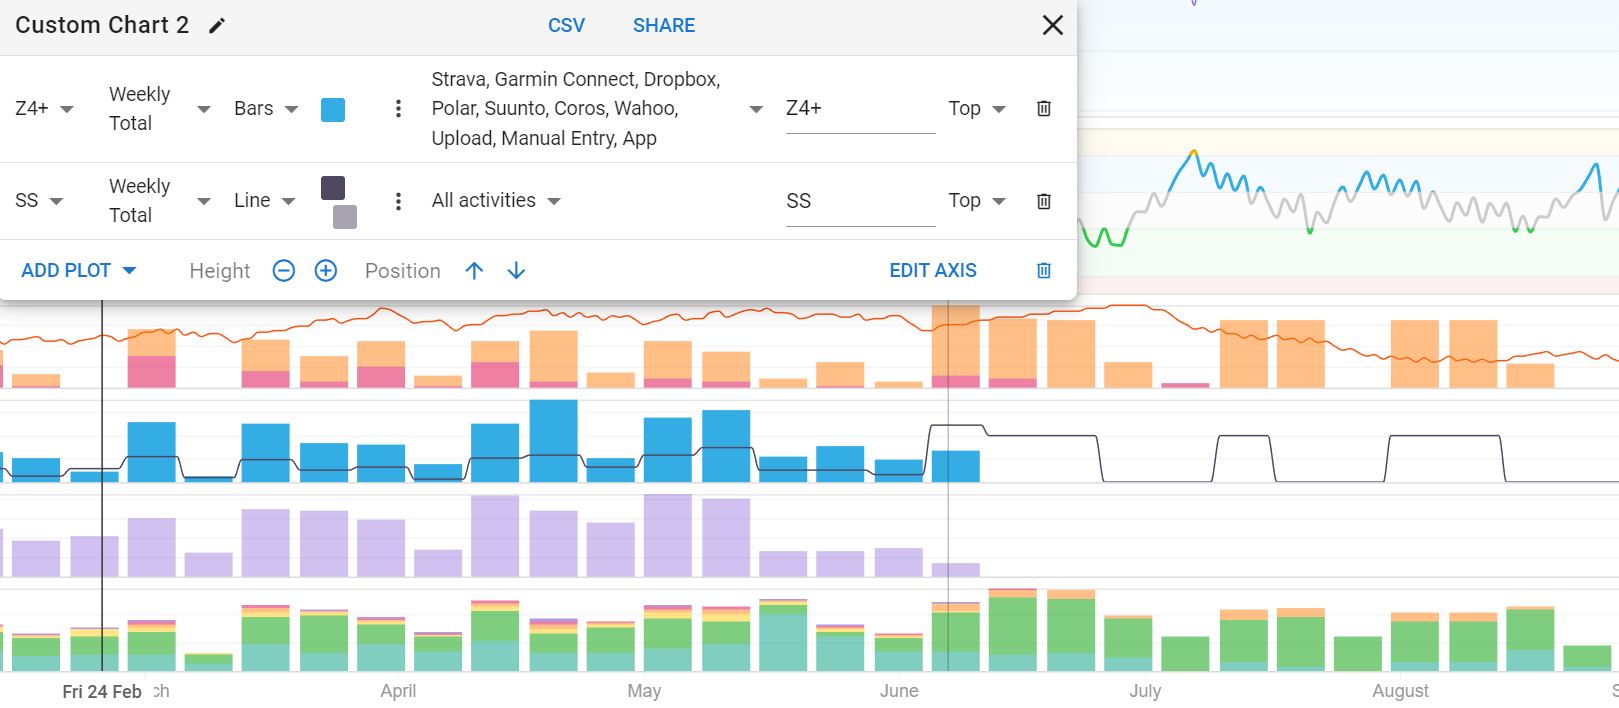
In my example, I have two charts:
top = target load (red line) and then a mix of workouts or simply an activity with the planned duration/load.
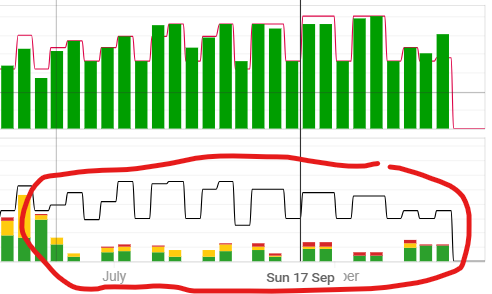
bottom = target load (black line) and specific workouts, usually no more than one mesocycle at a time (with detail). In this screenshot, I was explaining a long term plan with a mentor coach (so had it freely available to share).
The add filter function and using source and select all possible sources removed the planned intensities from the chart. I can add one tab with unfiltered and one with filtered , and problems solved! Thanks for the tips 
2 Likes
Hi Gerald,
I’m looking for a similar feature. Is there a way to show ONLY planned activities on a chart, so an activity that you have created for the future but haven’t acutally done yet (maybe like adding this to the SOURCE filter).
An example being having a chart combined of target hours, planned hours (this new thing I’m talking about), and actual moving hours (exists already), so you can see if you are meeting your target plan, and if you have programmed enough hours for the plan in the fitness tab.
Hope that makes sense, let me know if I need to clarify, thanks.
Hi Adam,
I understand what you are asking, but I don’t think it’s currently possible to do. If it is, it’s not something I’ve looked at specifically; which is why I have my Excel file as an external planning tool.
On the chart, everything left of today is actual, and everything right of today is planned.
Perhaps the compliance to plan, which shows on the activities page is what is missing from a chart, which is based on load (the green only chart), not duration (time in zone) when load is set.
If you remove the load target, it shows the compliance based on time in zone only, providing you’ve set up the target hours.
Thanks for the reply, I’ll use what you’ve suggested and hopefully they add a feature like this at somepoint in the future.