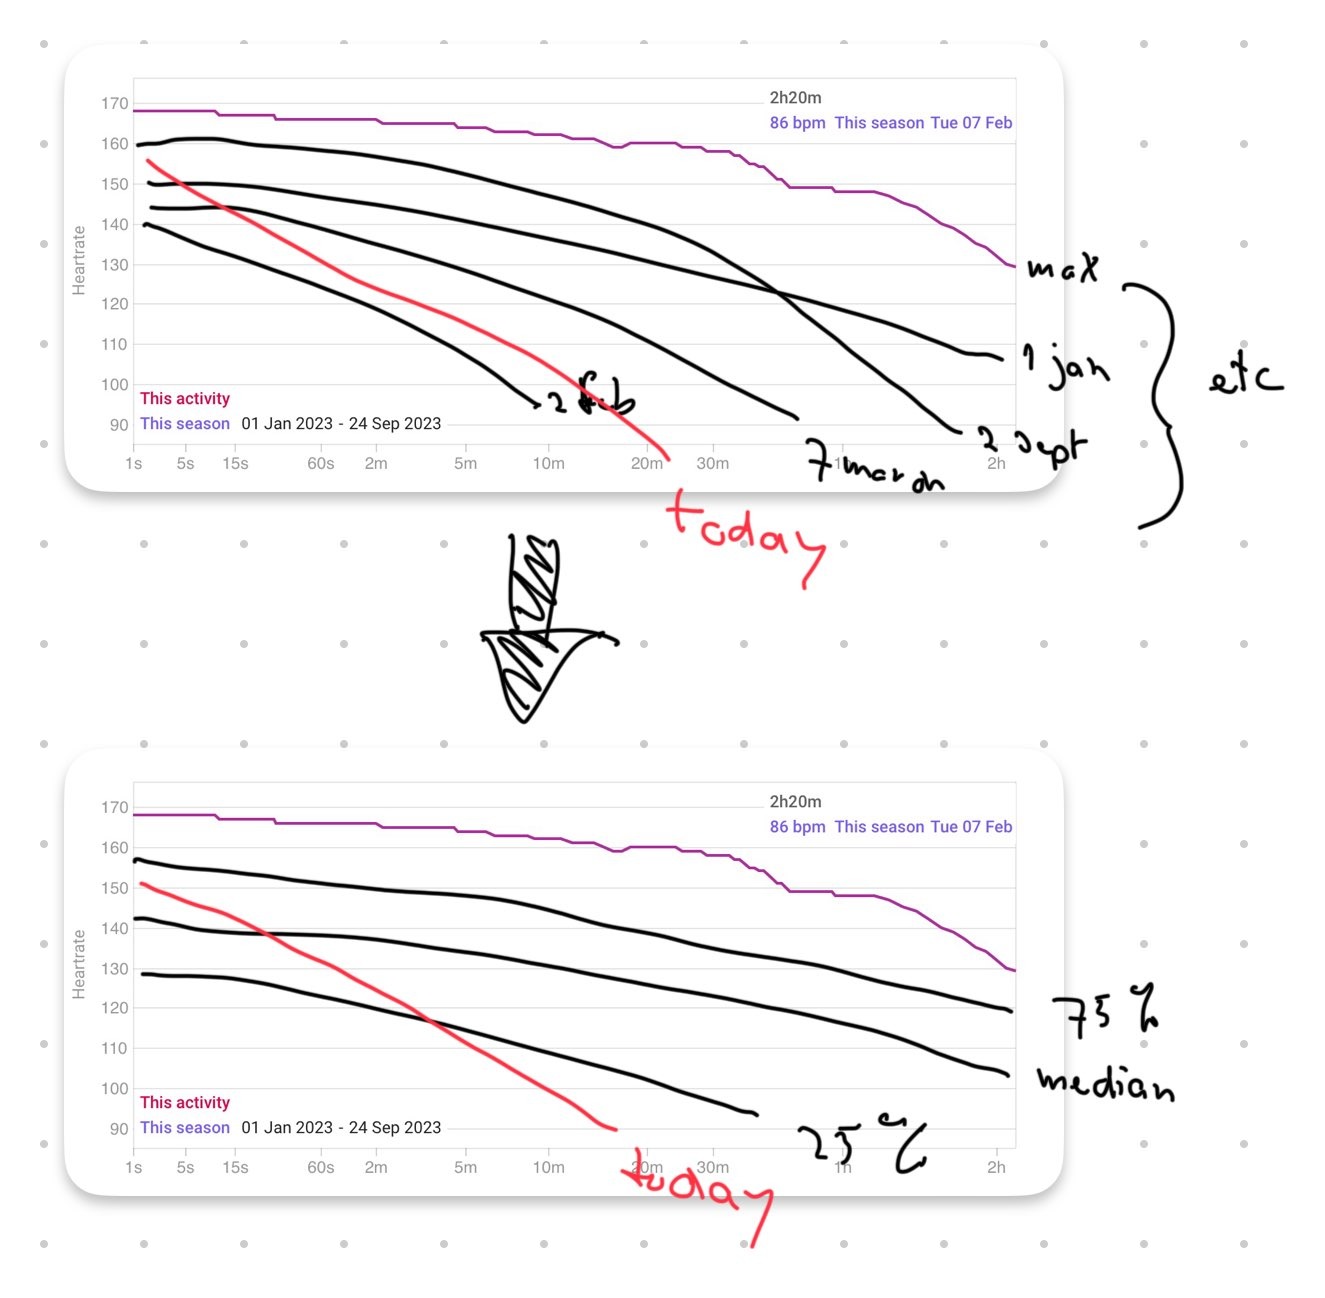
For the heartrate you have great curves showing the peak by duration. To gauge a training it is usefull to know this 100-percentile curve (i.e. the peak one). plus the 75%, 50% (median) and 25% one. E.g. my peak 10 second-heartrate could be 160 bpm, but my 50% would be 140 bpm.
It is classic percentiles. See the diagram: you take 100+ prior trainings and rank them at each time interval- this yields the max (your current graph), 75 percentile, median and 25 percentile. It gives a good idea of how my training was compared to my historical performance.
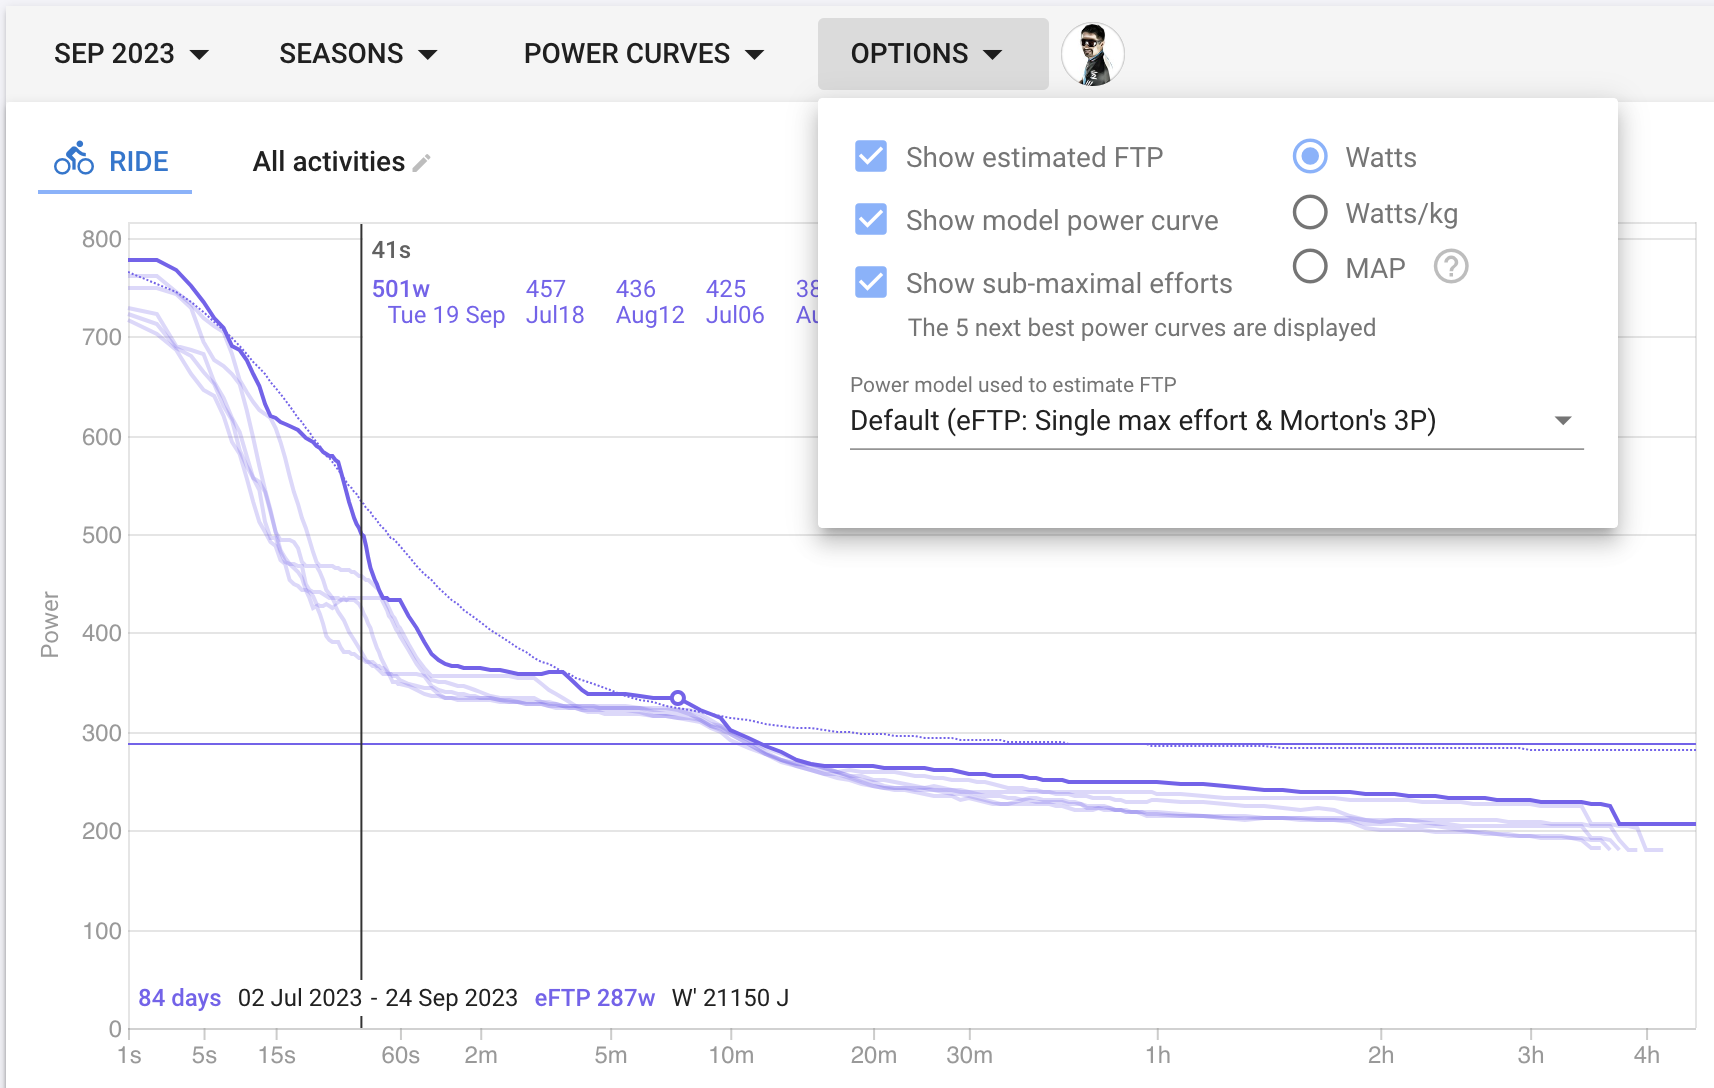
The same approach works for HR (as discussed now), power curve and speed curve.
…Also as we evolve (or age) over time, we could give each training a weight of exp(-(today-training date)/365). then the ranking works the same. Just with weighting trainings in prior years much less
For the moment focus on a single time period, say 10 min. Take all trainings done ever (including lousy ones)Rank the HR for all of them. This give you: The highest, the median and the lowest and also 75 percentile and 25 percentile. Plot these 5 points. Do this for all time periods. Now you know deeply what good, medium and bad looks like