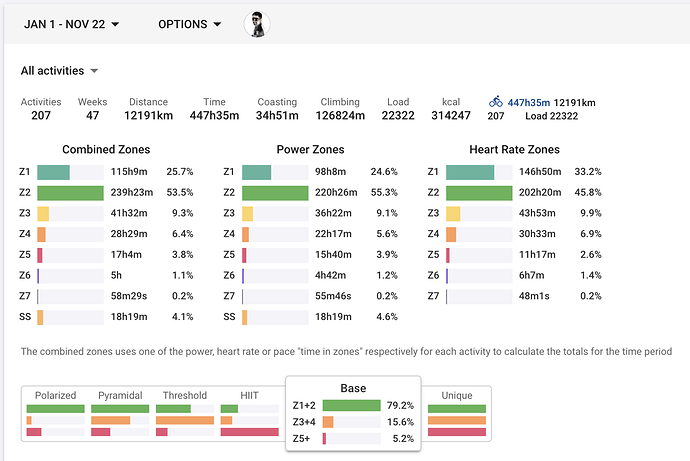
Are there any plans to create something like a dashboard view ?
Specifically what I would like to create goes beyond what i can do on the /fitness view.
For example i would like to create a dashboard showing me Total KM this year , Total Elevation gained this year, …
In the /fitness view I can create this view as cumulative total, but it is a little hard to read.
Additionally it would be helpful in the graphs to have some background color coding. So basically it would be useful to have in custom form the same option as you do in the „standard form“ view (define color code for a specific value on axies)
Example: Define red if lower than value x , yellow between x and y and green if its bigger than y
