Number of trainings in diagrams

Hi all and TIA for your help.

2 Questions:

I‘m struggling with getting the number of trainings in a Diagramm ( e.g: how often did I run in a week/ month) - how can this be done ?

I want to look at some figures. ( km) on a weekly AND monthly basis - how do you do this ?
create 2 diagrams, create 2 tabs with different settings ?

Thanks for your help !

Hi,

On the fitness window, there is a chart for weekly mileage, and on the totals window, you can play and filter range of dates and activities


Hope this was helpful,

Margarida

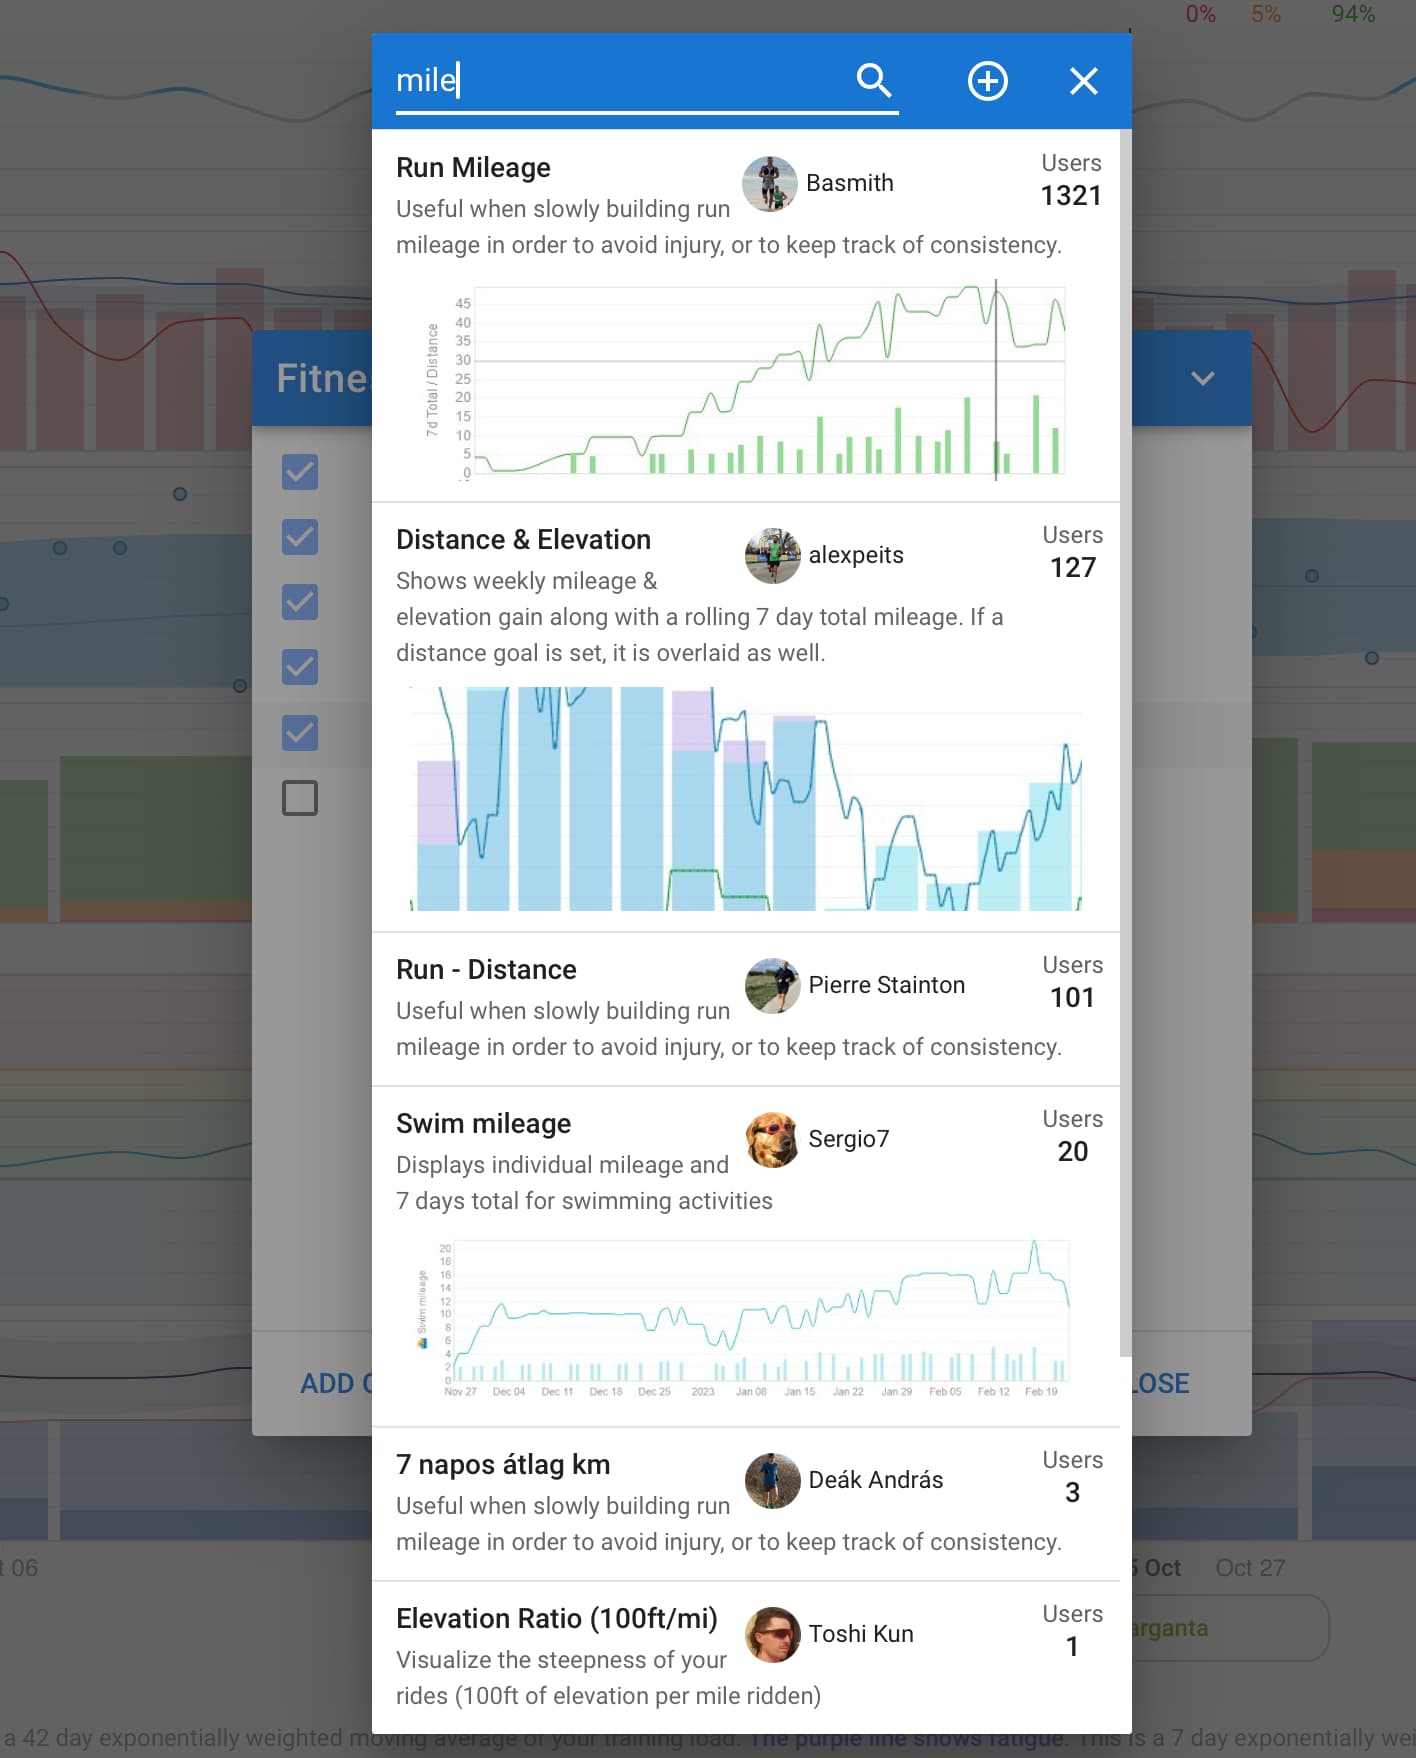
Thank you Margarida, but I’m not searching for weekly milage.
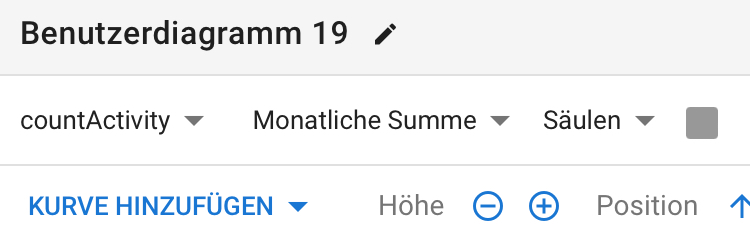
I would like to see how often have I trained in one week (number of activities) and would like to plot this in a diagramm…
maybe it’S to obvious and I cannot see it.
BR

This one should take care of your second request: (adapt range and filtering to your likings)

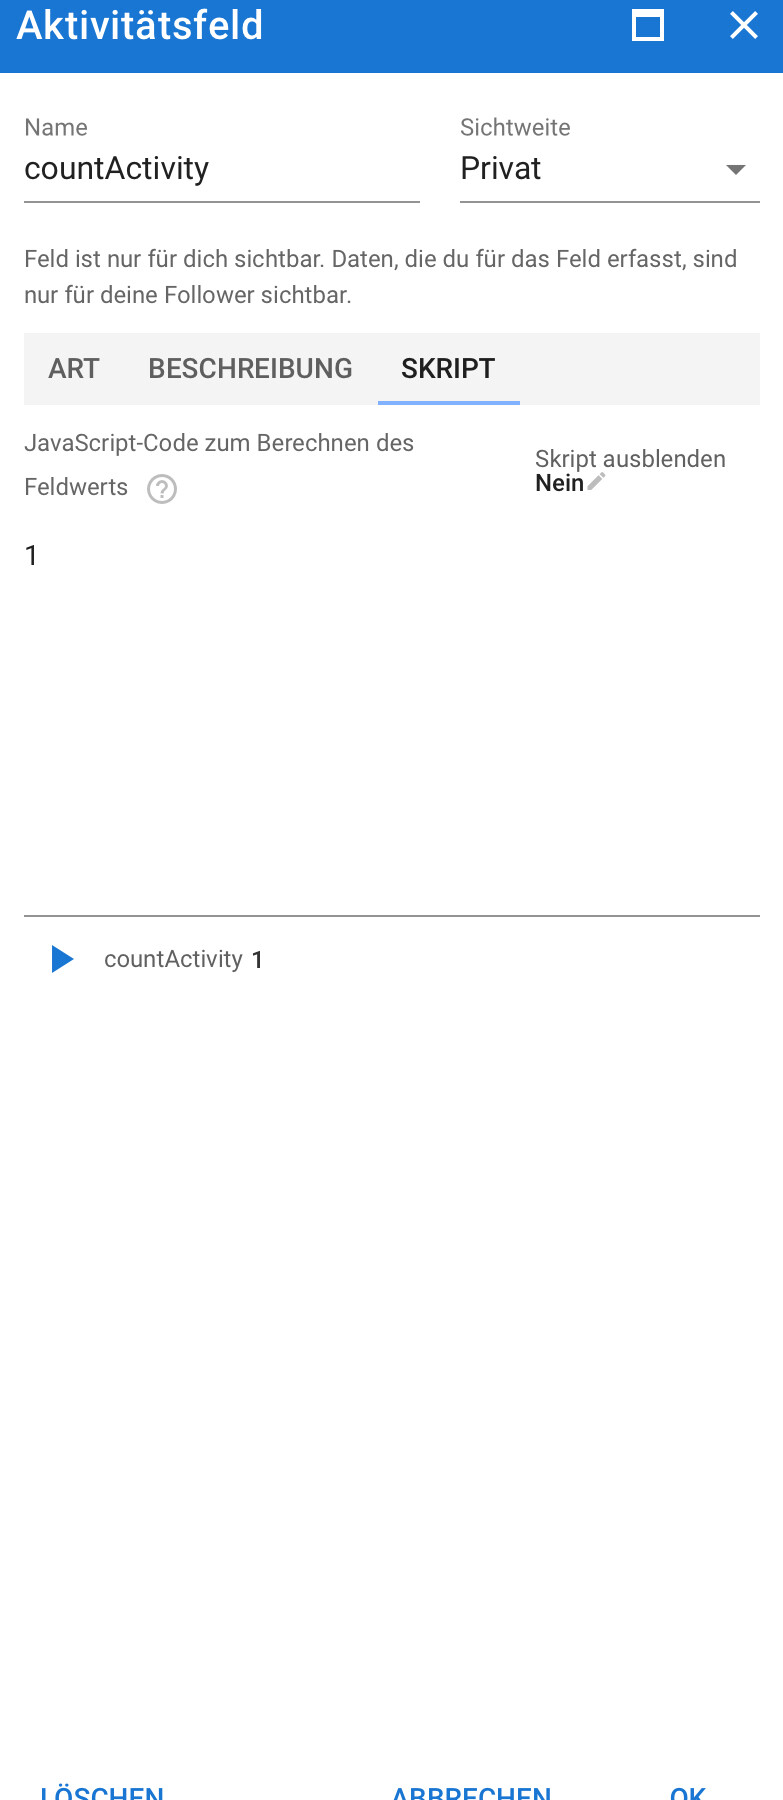
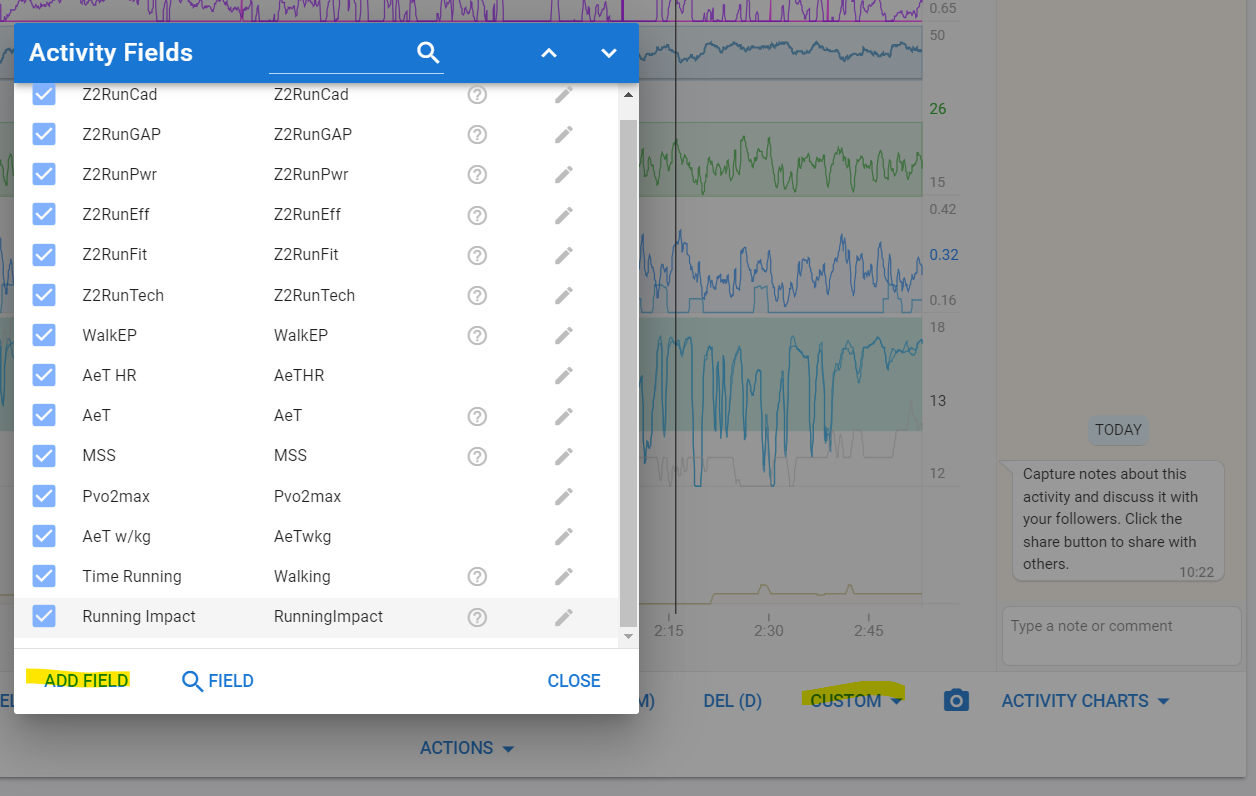
For the number of activities, there’s no direct solution. It’s probably possible with a Custom Activity field that increases a counter each activity and resets on Monday for example.
Might be something that @david can easily implement? No one ever asked before…

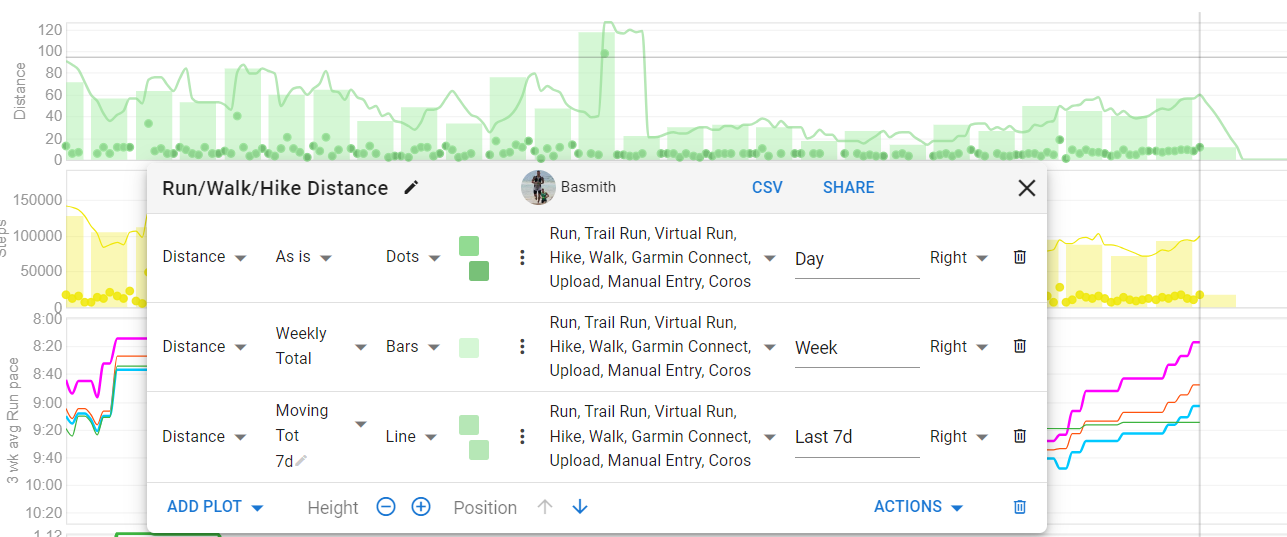
thank your for your support for the second topic, I already played around with something like that.
I think it is some kind of compromise - either you can’t see the days (ther green dots are more or less on the same “height”) - or you can’t see the long-term developement.

not tht important for me - wanted just check (as a newbie)if I miss out an option to handle this.
thanks !
BR

You can create two charts. One for the daily distance, one for the weekly/monthly.

1 Like

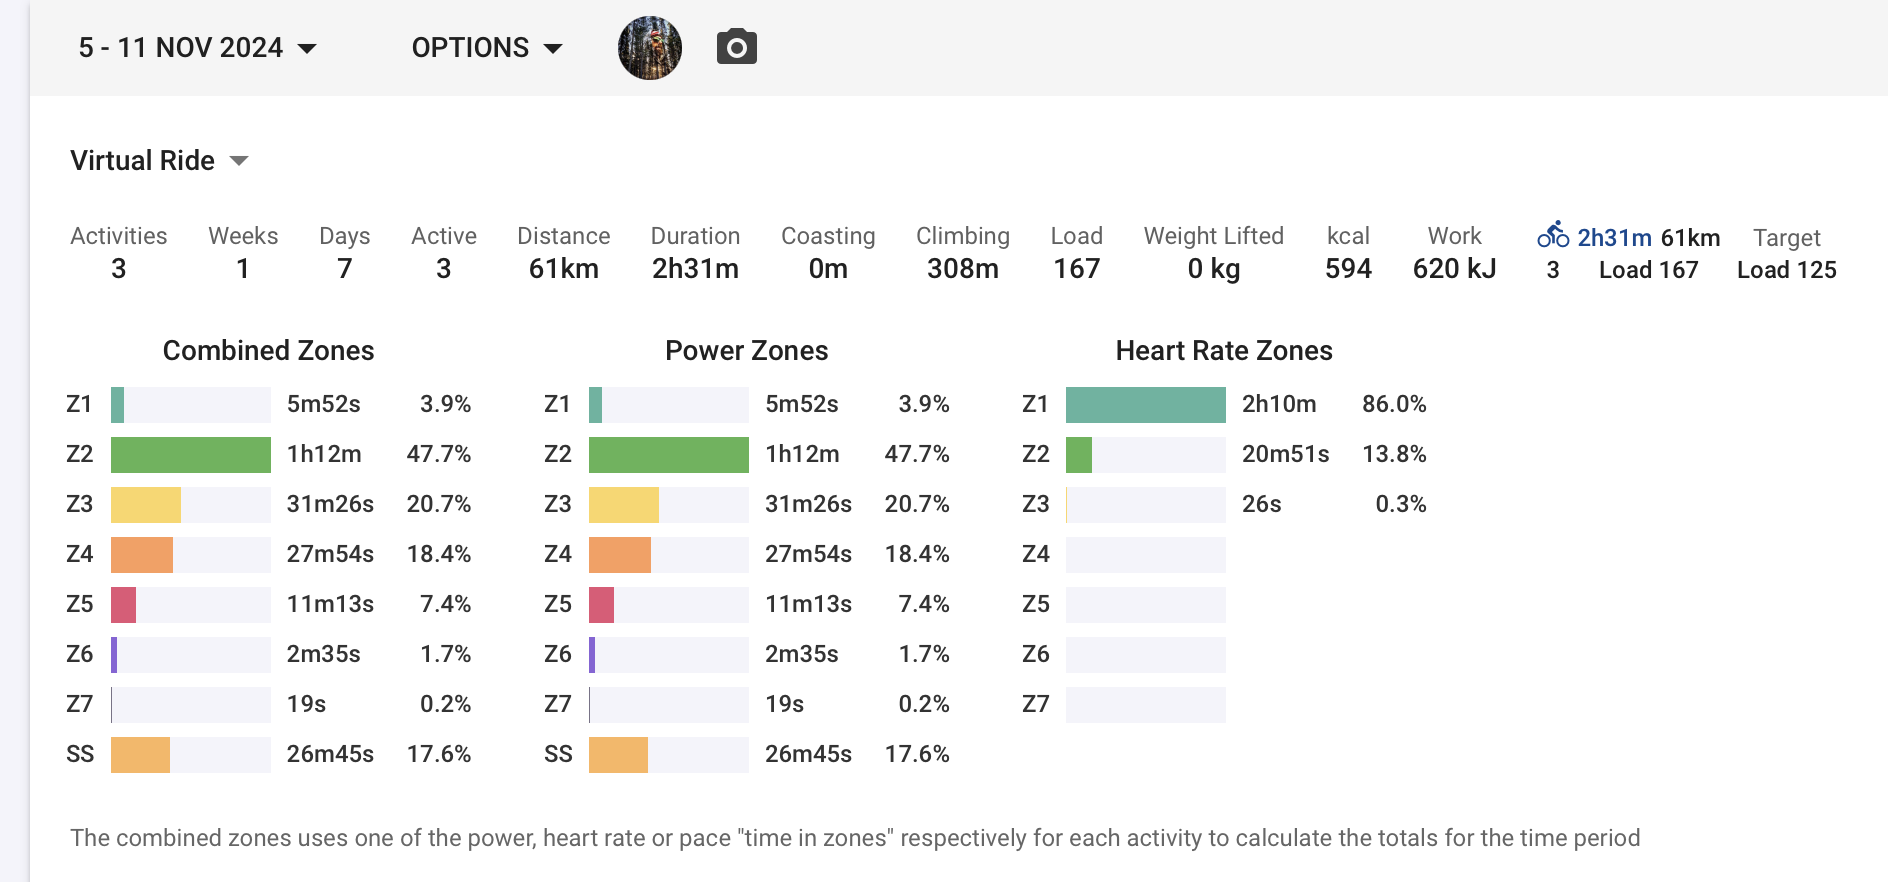
The field is obiously already “here” - looking at the first line in mageridas fittness-overview - there is “activities 3.”
Interestingly: I can’t see this line in my overview

It’s in the Totals View where you can set a date range.

1 Like

yes - will do.

I thought, there could be the possibility to toogle between 2 views, my solution will be that I create 2 tabs so I can toogle :slight_smile:

For counting activities, it is probably possible, too.
Create a custom field ‚count activity‘ and set it to 1

Then you can create a plot with weekly sum or monthly sum

2 Likes

Hi @R2Tom - thanks, that looks good.
How can I create a “Aktivitätsfeld”, where is the starting-point ?
BR

Bottom of Activity page - Custom - Add Field

2 Likes