I’m seeing this in shorter intervals. Here’s an example from my Aug 11 activity:

This is from my Aug 10:
I’m seeing this in shorter intervals. Here’s an example from my Aug 11 activity:
This is from my Aug 10:
Yes, thats the way the algorithm for Normalized Power (NP) works.
NP is generally considered valid for longer efforts. Something like 10 minutes or longer.
Interesting - do you have a link or explanation of the calculation? From what I see, it’s the 4th root of (the mean of (30sec averages to the 4th power)), but for short intervals there will be an interval of different duration length that skews.
I would have thought NP >= Mean Power for all durations.
(I wasn’t using NP for my short efforts - just noticed it was lower than average and assumed something was wrong.)
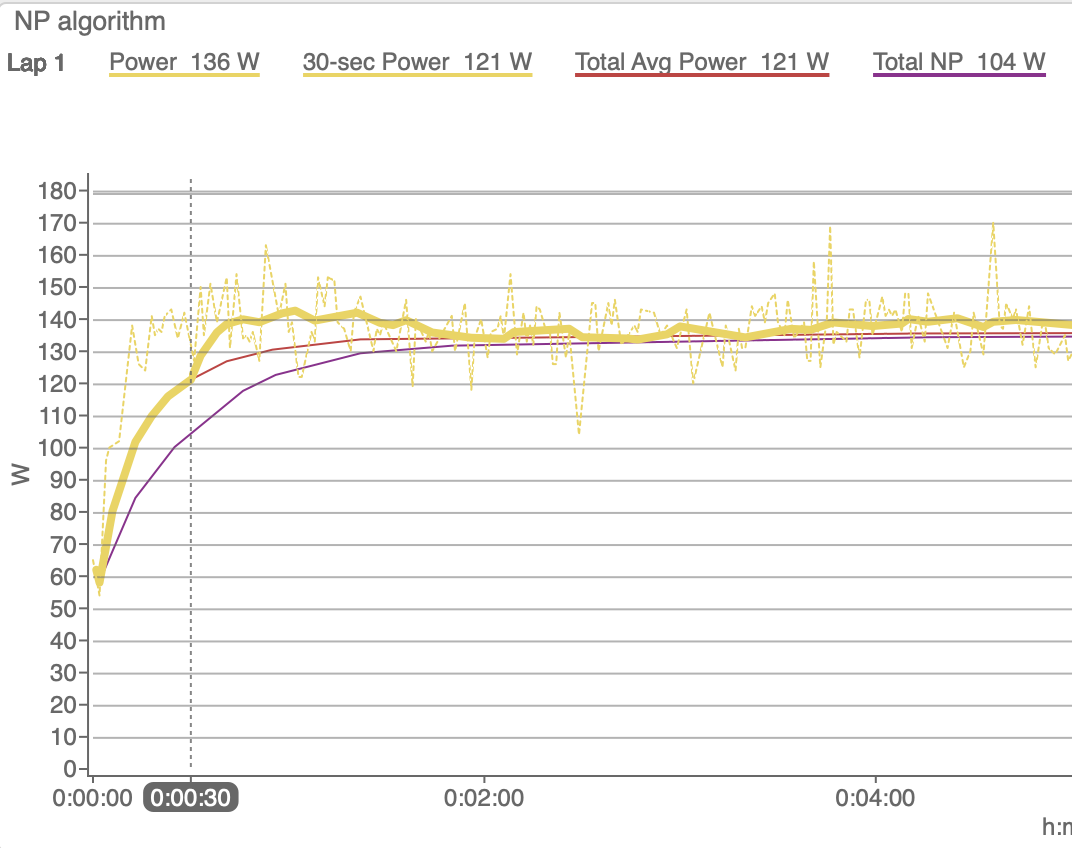
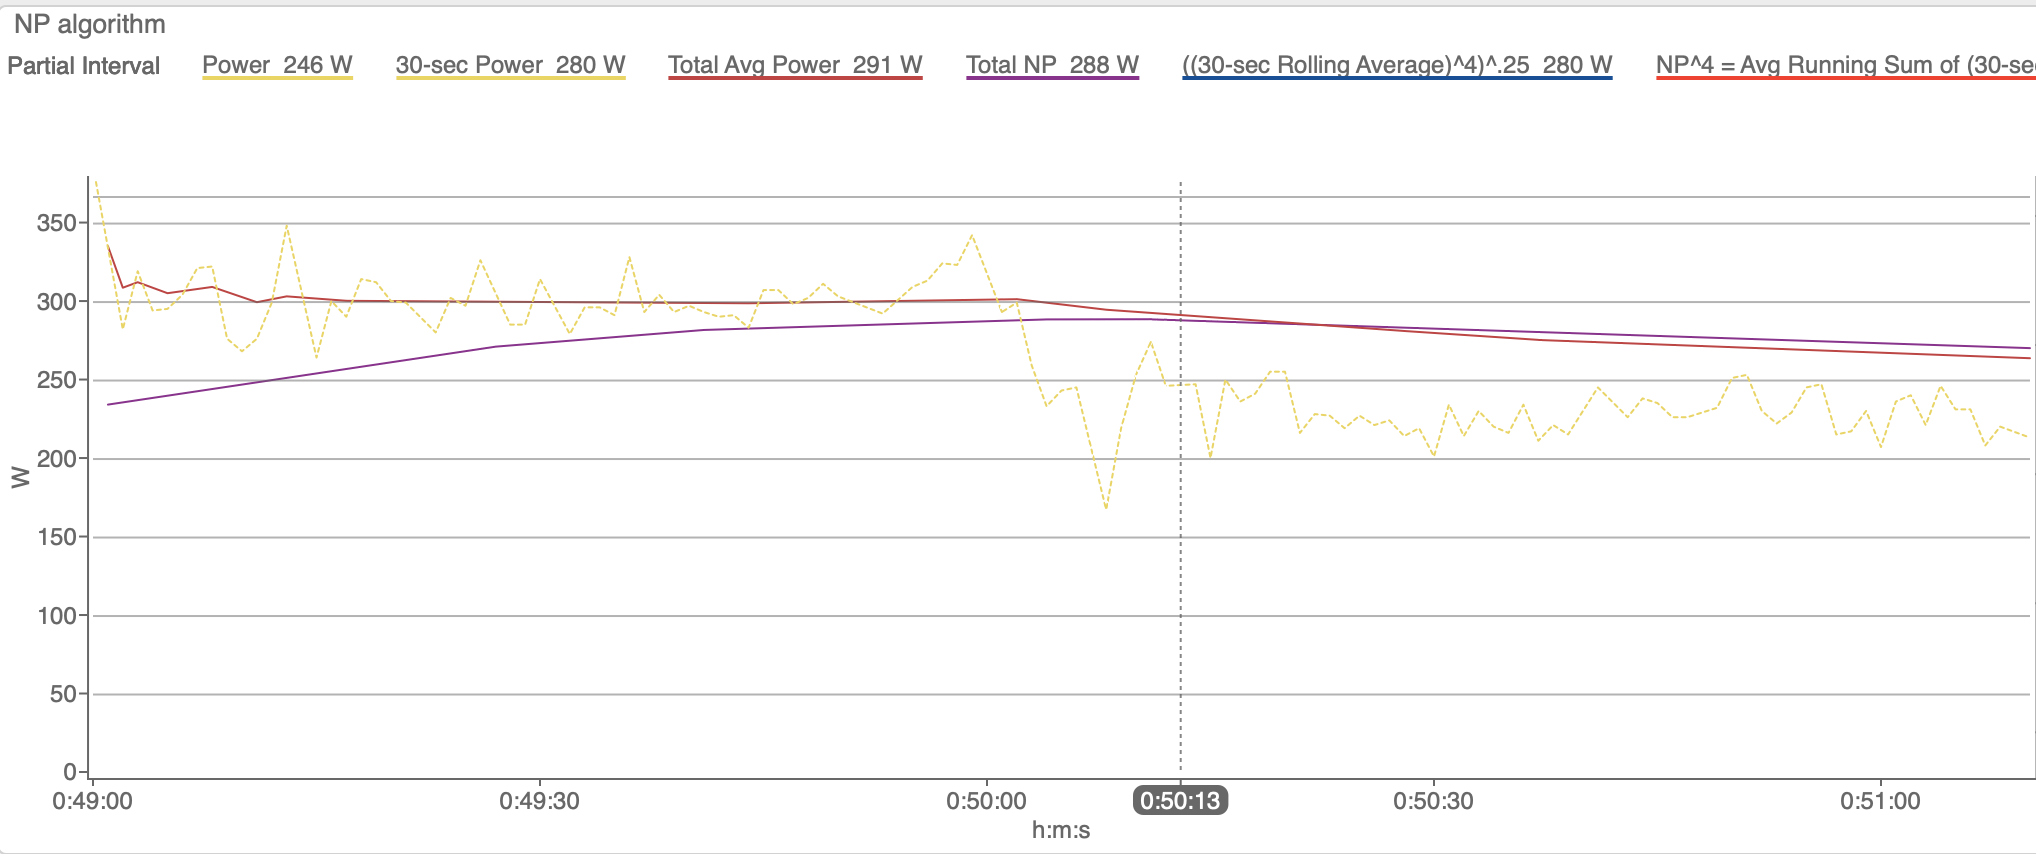
Start by considering the rolling averages only. Here is a workout in Erg mode:
The last two are what you would see on a bike computer when ending the ride at that moment in time.
See how 30-sec power and NP are a similar shape? The different shapes are due to the specifics of NP using 4th power and 4th root.
Ok, the other thing to notice is the lag time - see how 30-second power (thick yellow line) jumps at 30-seconds? Up until that point, it included zeros for some of the 30 second average.
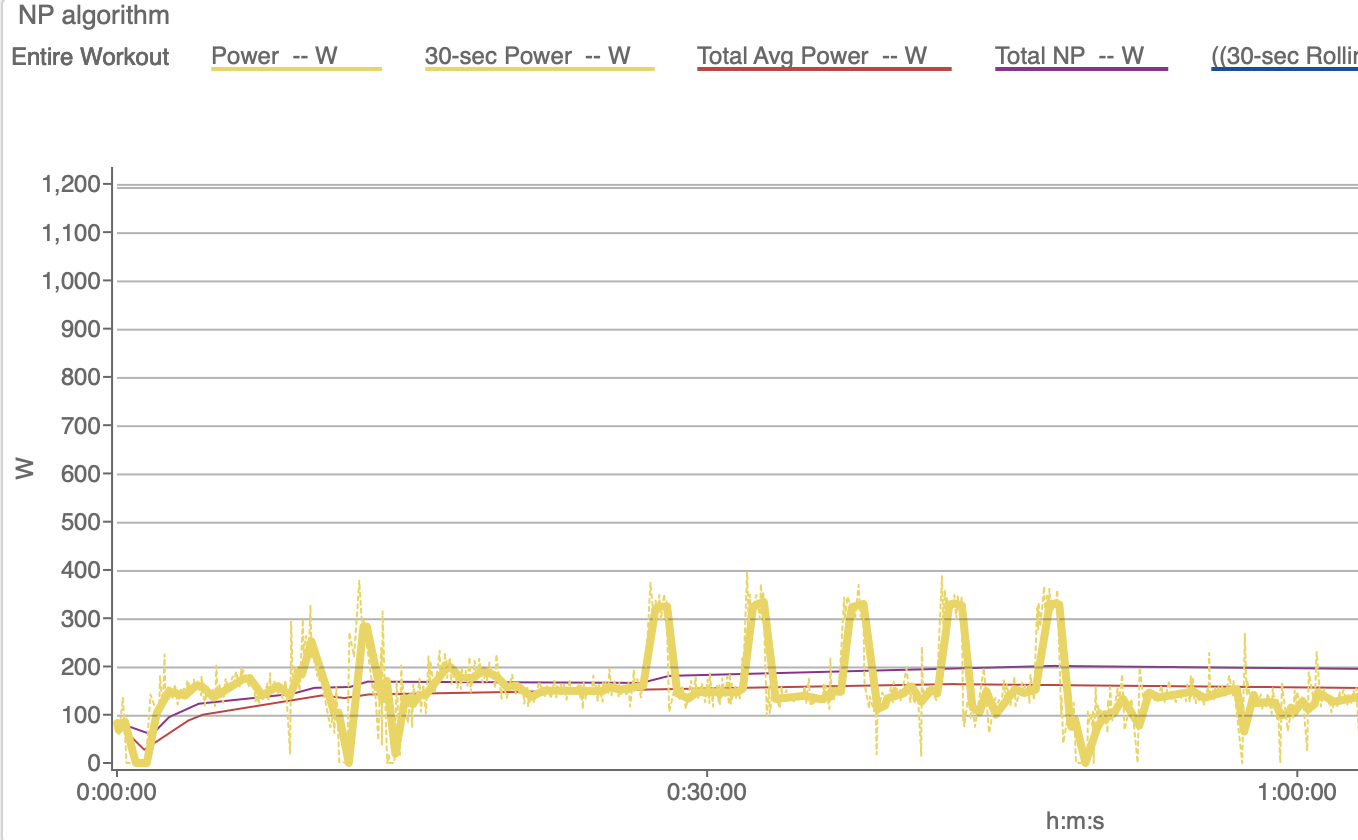
Now lets look at some 1-minute intervals… part of the workout:
Lets zoom into the first 1-min interval:
Again, like in the first picture, NP is lagging behind the average power for the interval.
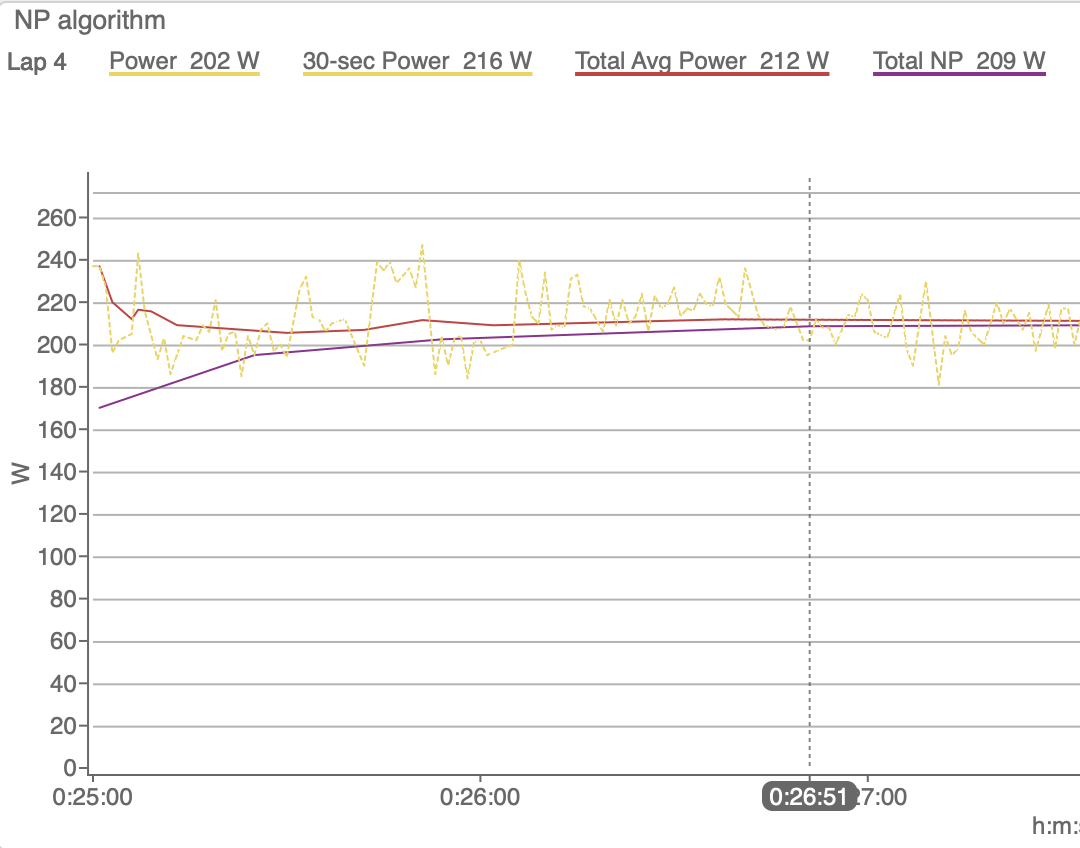
Here is a tempo interval, it takes almost 2 minutes for Interval NP to get within 3W of Interval Average Power:
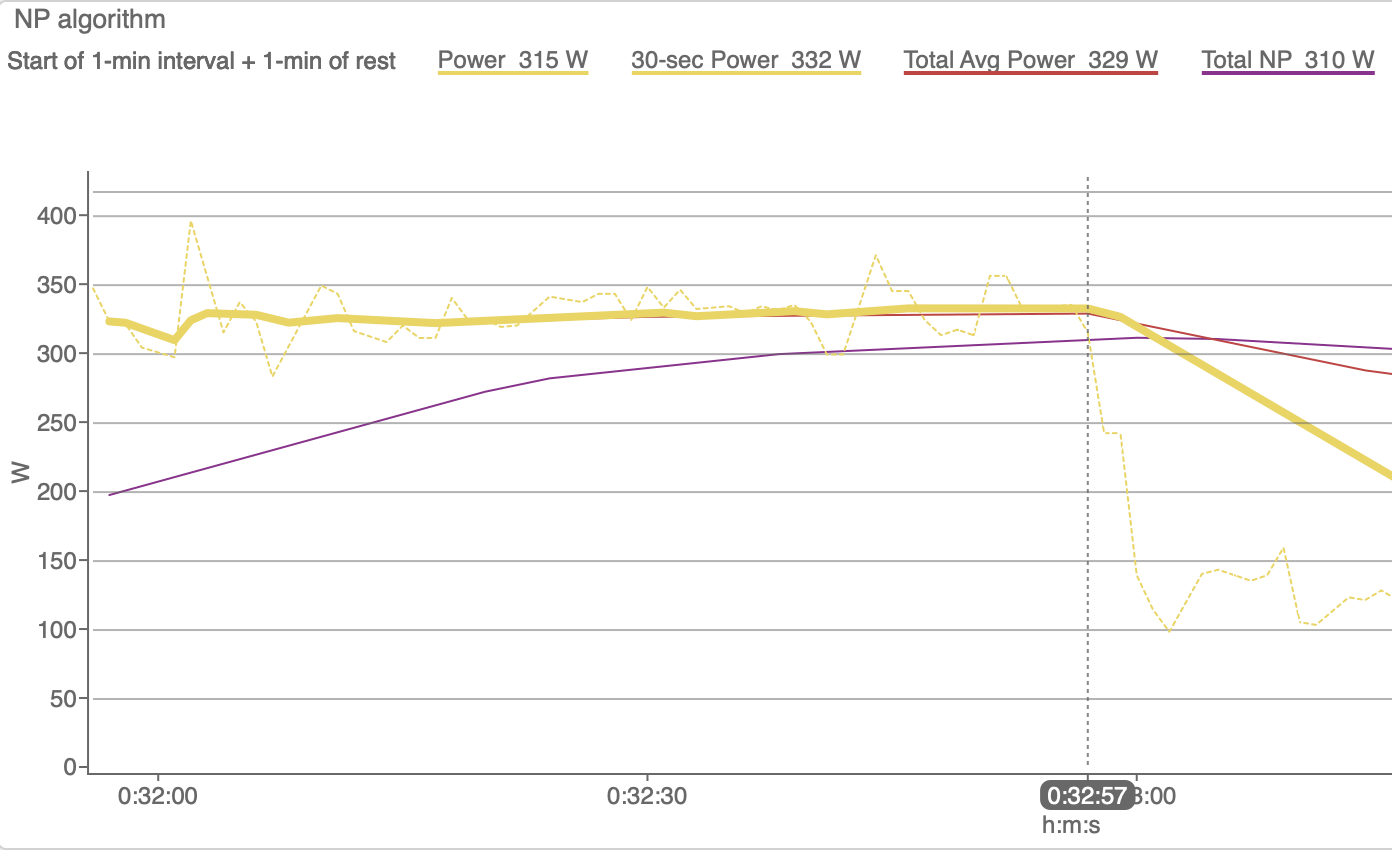
Here is a 1-min hard start (300W) then settling into tempo (225W)
and it takes roughly half the time for Interval NP to get within 3W of Interval Avg Power. After that, Interval NP is greater than Interval Avg Power.
Hope that helps.
Thanks for the examples.
From what I understand, the discrepancy in NP < Avg.P is due to the 30sec power filling 0s as needed for the first 29sec of an interval. My original confusion re: NP < Avg.P is that if we have any set of positive numbers, the quartic mean (as in Normalized Power) can never be less than the arithmetic mean (as in Average Power), though when the 30sec power fills zeros as needed, this clearly fails. ![]()
Yep, NP has very little to no meaning for short parts of a ride.
Understanding metrics is hugely important! Simply taking numbers that your wearable spits out without knowing their strengths and/or weaknesses often makes me react ´Yeah, sure ![]() , whatever…´
, whatever…´
Yes, it’s about boundary conditions when running the algorithm. And the NP algorithm is based on physiology, so it helps to understand how it evolved.
My day work is developing audio software. Interestingly, this exact type of problem occurs in that context. For example, “loudness” of audio is typically computed over some interval of time. Common intervals may be along the lines of 300ms for RMS, for example. It can be much longer, for example Short-term LUFS uses 3 second windows.
During the initial 300ms, or 3 seconds (for example), the naive implementation simply fills the initial window with silence. The same as filling the NP window with 0 watts. The result is very under-estimated initial measurements, which in the context of audio can lead to audible artifacts depending on how your algorithm is responding to these measurements.
For my software, there’s an option for “adaptive windows” which dynamically adjusts the size of the window during initial start-up, or when an “edge” is detected. In principle you could do similar with NP and you may end up with more intuitive results. But there isn’t really a perfect solution since this method causes the initial reading to be weighted more heavily than they would be typically.
Interesting; thanks Aaron.
Thanks guys, this is very insightful. I was very surprised to learn this as my experience has always been that NP => AVG. I have been a TP user for c. 10 years and in the process of transitioning to ICU, which is mindblowingly cool btw ![]()
![]()
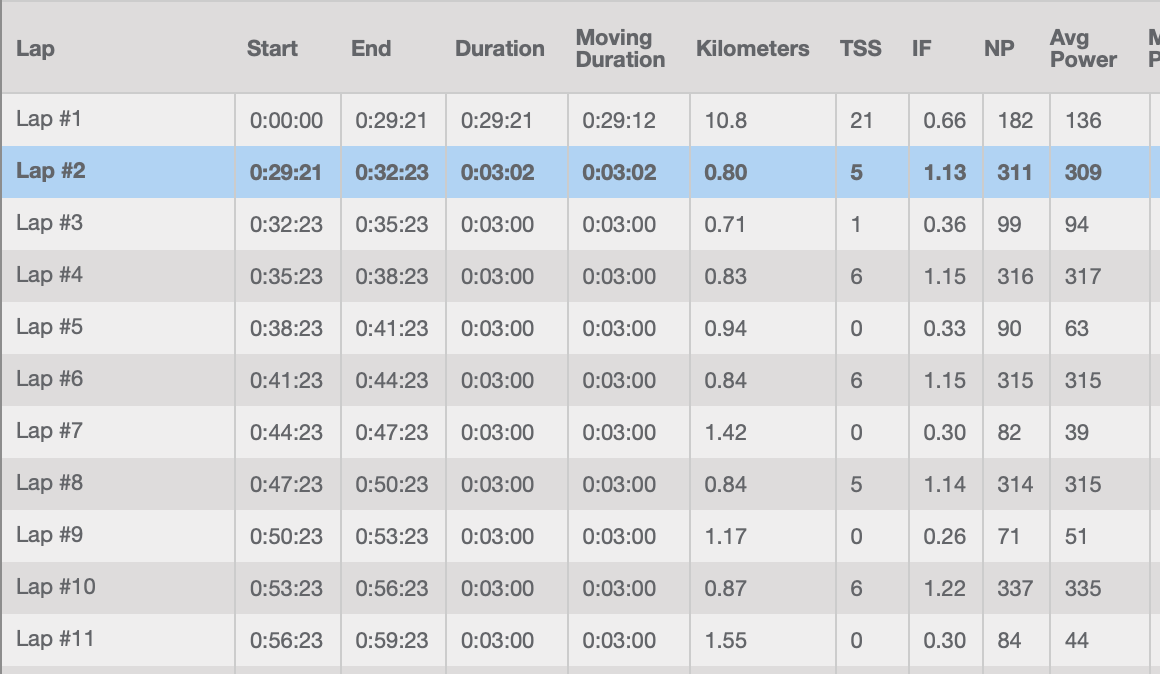
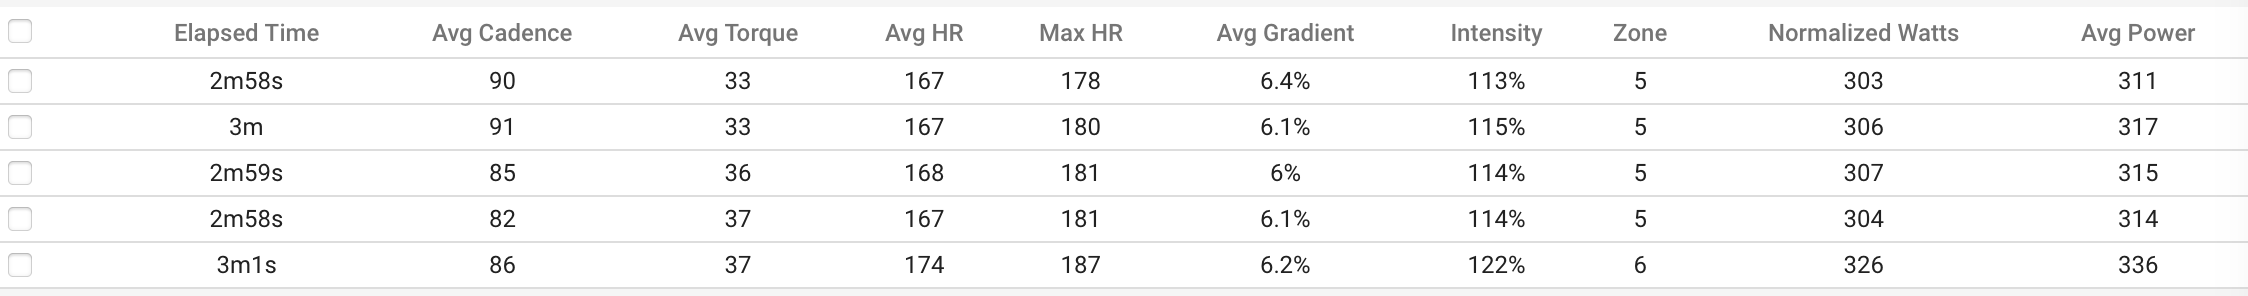
below is a comparison between TP and ICU. Any insights into why TP is much closer aligned to AVG than ICU is (for interval sets with no expected “0s”
Without going into details, the 3 minute reps are too small for nature of the intervals NP algorithm to “catch up”.
I wrote a little rant about the NP model a couple of weeks ago. As someone said previously in this thread its important to understand the underlying model so that you can make sense of what the metric is telling you.
https://medium.com/@johnpeters_19650/flaw-in-the-np-model-3ee849080151
There’s more on the forum discussing differences and reason’s, but here’s one of the topics that clearly state why this isn’t as straightforward…
Thanks @Neal_C @John_Peters_endura.f @MedTechCD
I now better understand the NP calc methodology and limitations, esp as it pertains to short durations. It aligns with the results I’m seeing from ICU, but what still eludes me is why the TP NP is so close to the Avg esp after considering the 30s lagging impact. Its like they aren’t following their own methodology ![]() . Appreciate this has now shifted to post more relevant on a TP forum than here, but thoughts appreciated.
. Appreciate this has now shifted to post more relevant on a TP forum than here, but thoughts appreciated.
My guess is that they’ve programmed the calculation differently to avoid the “lag” caused by the 30sec average, probably by filling it somehow as Aaron describes.
If it were me, my first attempt (as someone who doesn’t do much programming anymore) would be: